
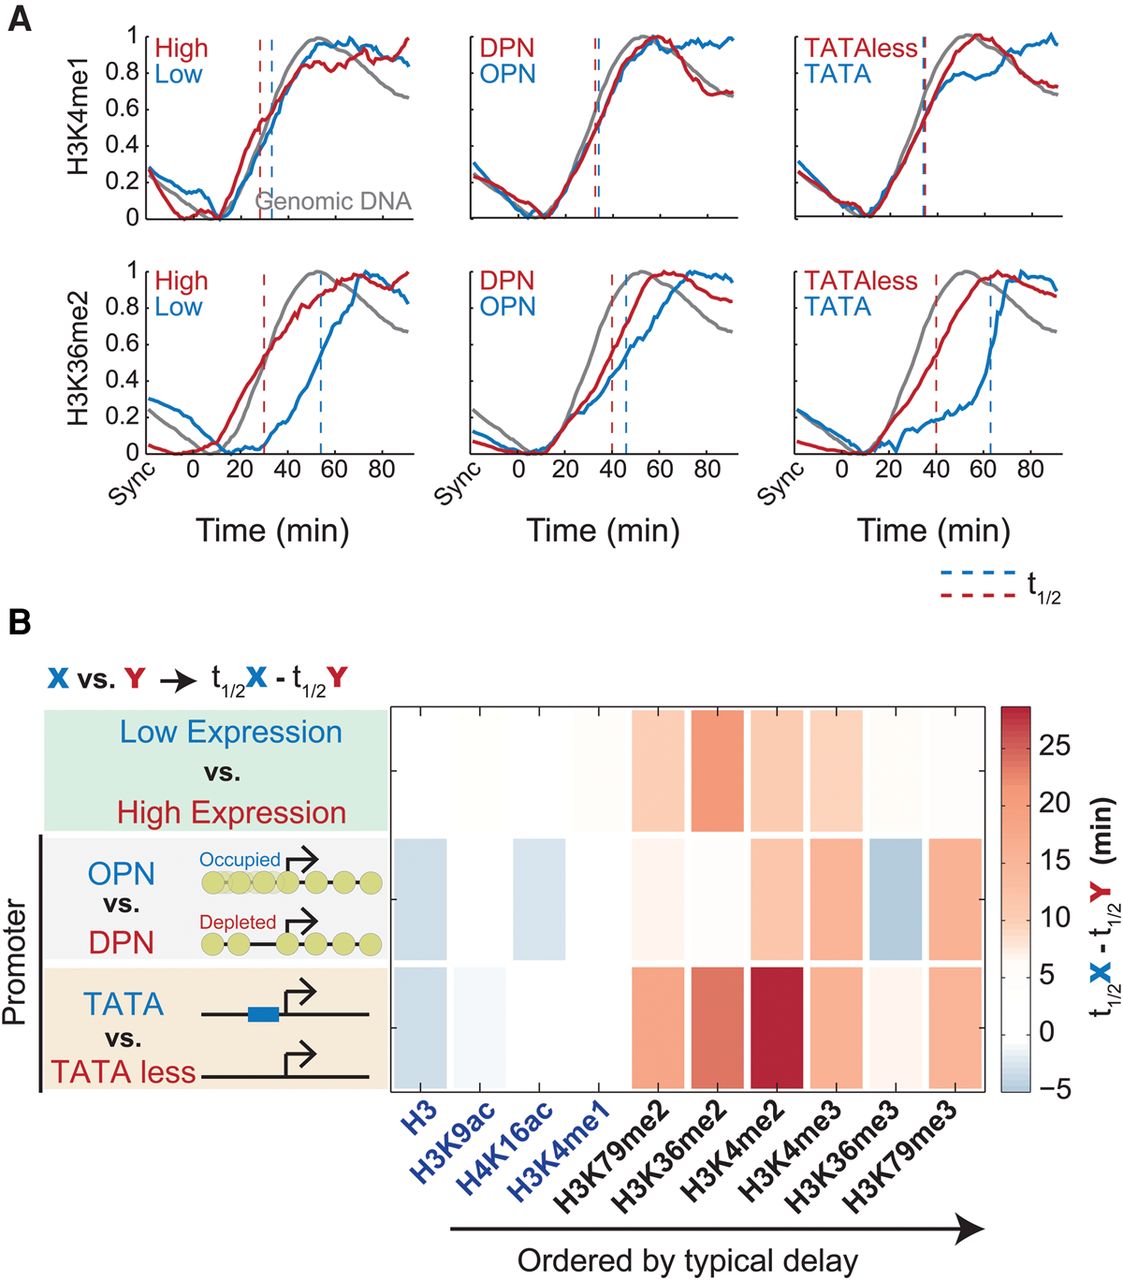
Figure 3.
Post-replication delay in histone modifications depends on gene expression and promoter architecture. (A) Replication-associated dynamics of histone marks (as Fig. 2A) calculated separately for genes with the 25% highest or 25% lowest expression levels (left), genes containing occupied or depleted proximal nucleosome (OPN or DPN, respectively) promoter structure (center), or genes containing TATA/TATA-less promoters (right). Genomic DNA was plotted for comparison (gray). Typical half-life (t1/2) was defined as the time to reach half-maximal increase (dashed line), averaged over the three late-replicating clusters (5–7) for all modifications and features, and plotted in B.


