
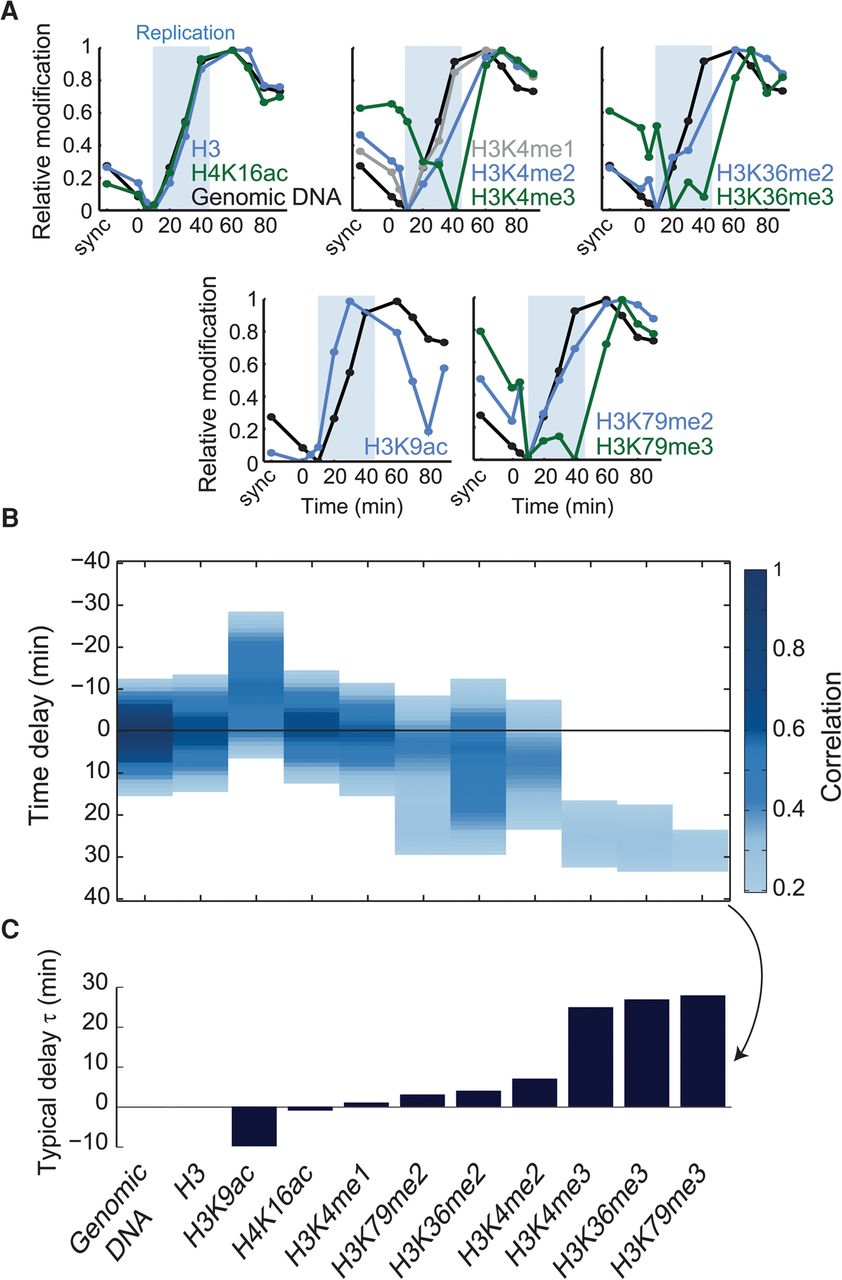
Delayed recovery of histone modifications following DNA replication. (A) Replication-associated dynamics of histone marks. Abundances of genomic DNA (black) or histone marks were averaged over all regions assigned to replication cluster six (mid-late replicating) (for more clusters, see Supplemental Fig. S6). Shaded blue area denotes the time period in which this cluster was replicated. Initial decrease in signal resulted from data normalization, reflecting the increase in signal from earlier replicating loci (see Supplemental Note S1). All signals are log2-transformed, normalized by the signal in synchronized culture, and adjusted to show the same dynamic range. (B,C) Delayed post-replication recovery. Correlations were measured between changes in modification levels at time t and changes in DNA content at time t − τ. These cross-correlations are shown as a function of the delay τ (B). Only correlations higher than 0.2 are shown (see also Methods; Supplemental Fig. S7). The typical delay time between DNA replication and the indicated histone marks was defined as the time τ showing the maximal cross-correlation (C).


