
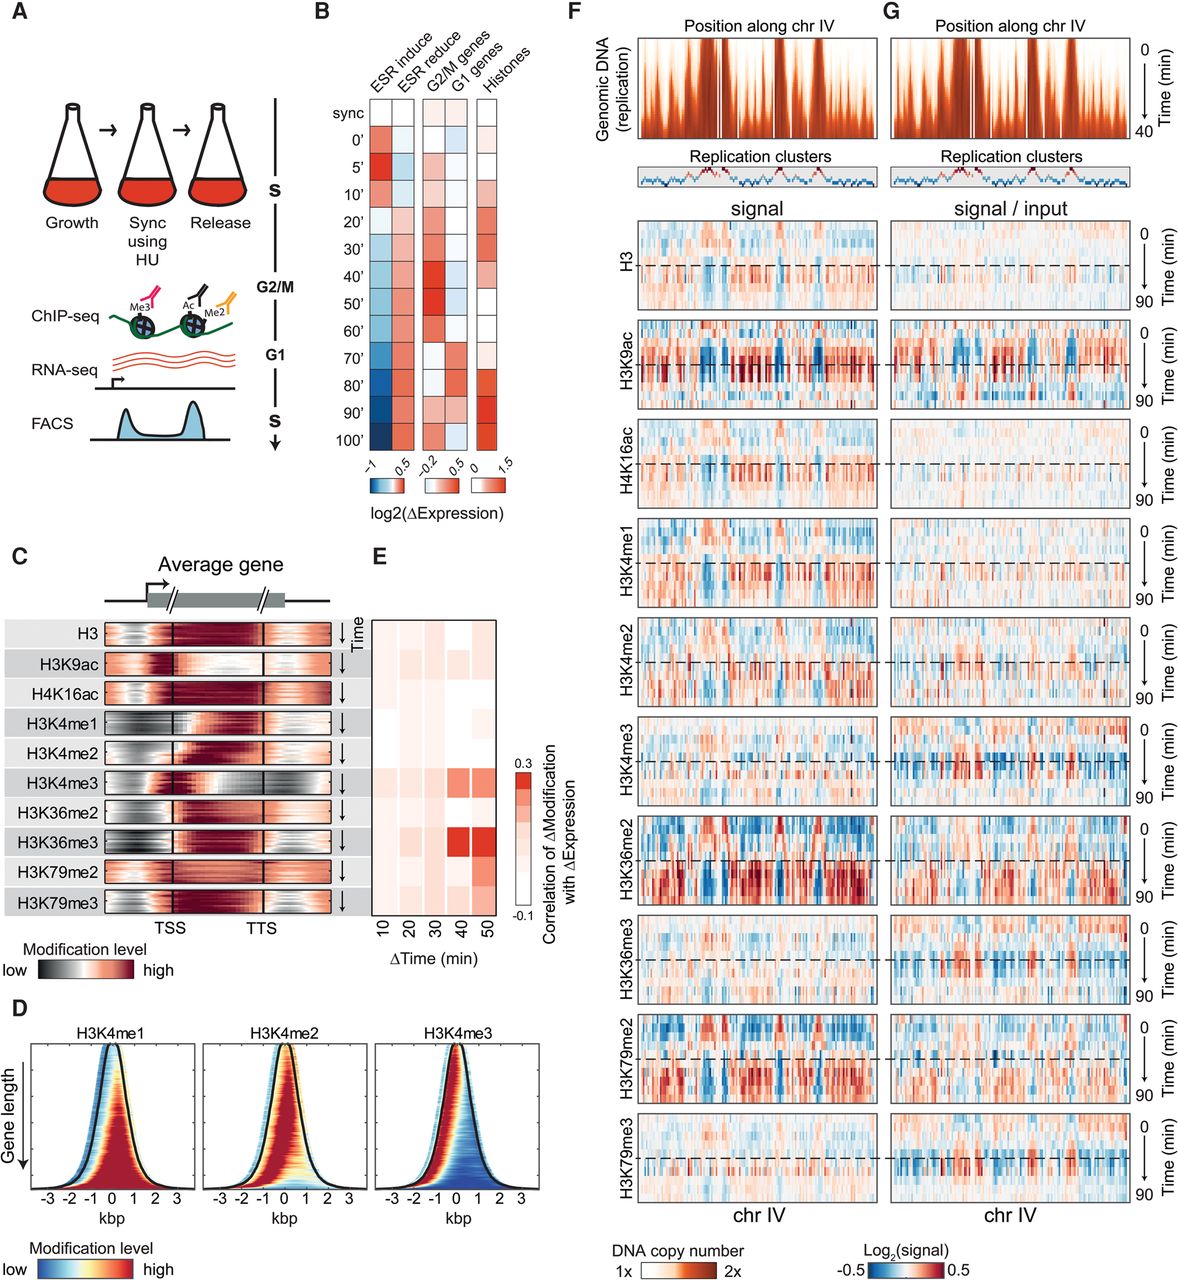
Cell-cycle dynamics of chromatin marks. (A) Experimental scheme. Yeast cells were synchronized to the beginning of S phase using hydroxyurea (HU), released, and followed as they progressed through the cell cycle. Samples for DNA staining (using FACS), RNA-seq, and ChIP-seq were taken every 5–10 min. (B) Gene expression along the cell cycle. Average log2 changes in the expression of cell-cycle genes (G1, G2/M, and histones) and environmental stress response (ESR) genes at the indicated time-points. (C) Enrichment of histone marks at different positions along genes. Metagene representation of the indicated histone marks. Subsequent time-points are shown from top to bottom. Genes were aligned by their transcription start site (TSS) and transcription termination site (TTS) and are normalized (through binning) to the same length. (D) Modification pattern on all genes. Abundance of H3K4 methylations for all genes (transcript +250 bp from both sides), sorted by gene length and aligned to the middle of the transcript. Black line depicts TSS (left) and TTS (right). Data for each gene were averaged over the entire time-course. For other modifications, see Supplemental Figure S2C. (E) Correlations between changes in gene expression and changes in histone modifications. Changes were calculated between time-points separated by the indicated time lag (Δtime). Correlations are over all time-points with the indicated shift and are confined to genes of the ESR (Gasch et al. 2000), which showed a significant variation. For all individual correlations measured also for all genes, see Supplemental Figures S3 and S1D, and for normalization by different total modification dynamics, see Supplemental Figure S13. (F,G) Replication-associated dynamics of histone modifications. DNA content (top; genomic DNA) and the abundance of the indicated histone marks (bottom; as indicated) along chromosome IV are shown. Each plot depicts the signal along the chromosome (horizontal) at different times (vertical) relative to the average in the entire time-course. Assignment of regions to replication clusters is also shown (see also Supplemental Fig. S5A–C). Dashed line indicates the 40-min time-point when replication ends (see also Supplemental Fig. S5D). Histones marks are shown with or without normalization by DNA content, in G and F, respectively.


