
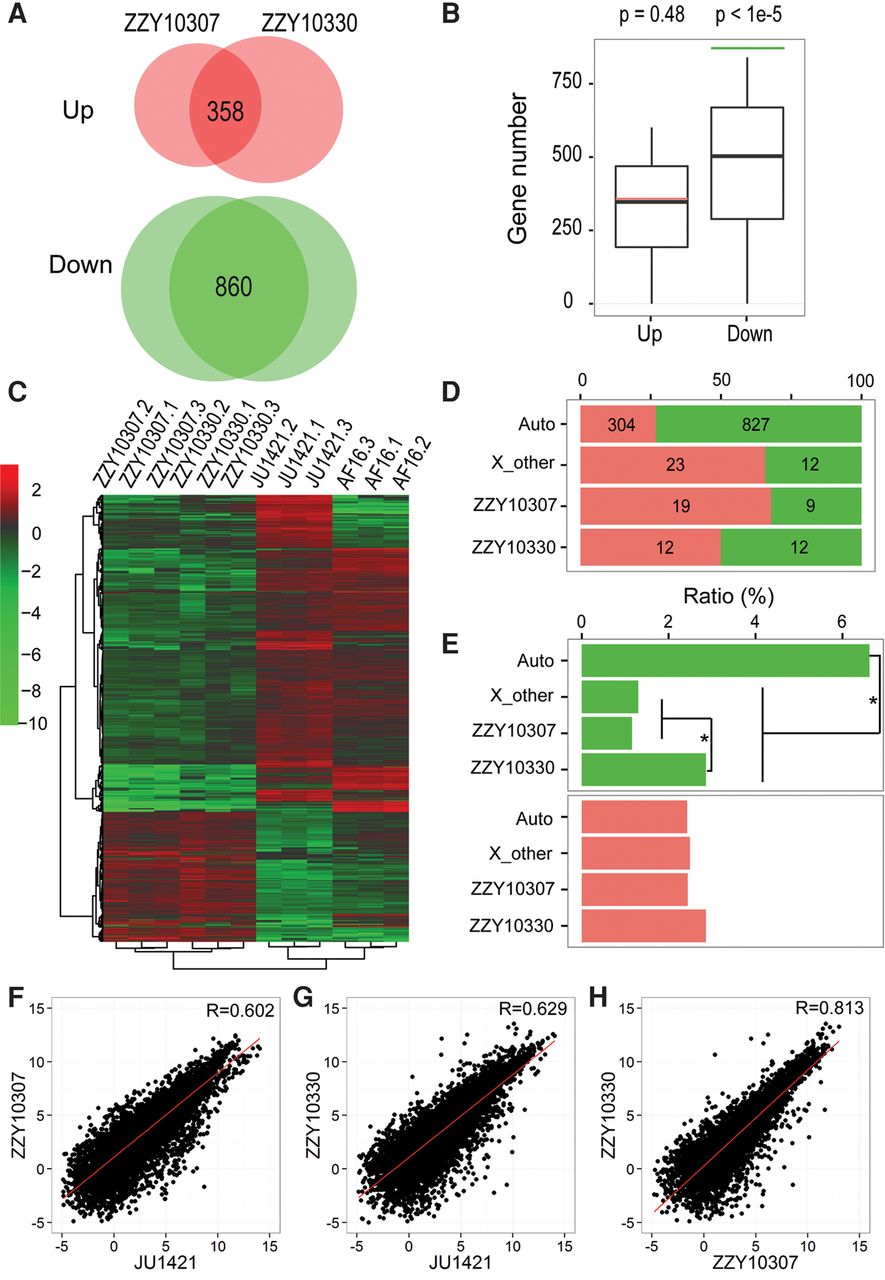
Expression profiling of coding genes in male hybrids and their parental males. (A) Venn diagrams showing shared numbers of up- or down-regulated genes between both hybrid males and C. nigoni. (B) The bootstrap test for the intersection of misregulated genes between two hybrids. The observed number of overlapping down-regulated genes (860, green line) is significantly higher than random, while the observed number of overlapping up-regulated genes (358, red line) is not higher than random. The bootstrap sampling was performed 100,000 times with the one-tailed P value shown on top. (Green) P < 0.05; (red) P > 0.05. (C) A heat map showing hierarchical clustering of normalized expression for the shared up-regulated (red) and down-regulated (green) genes in A for each RNA-seq sample of C. briggsae (AF16), C. nigoni (JU1421), ZZY10330, and ZZY10307. Expression of each gene is normalized against the average of 12 samples. (D) Chromosomal distribution of up-regulated (red) and down-regulated (green) genes as defined in C. (E) Percentages of down-regulated (green) or up-regulated (red) genes on autosomes or the X Chromosome. Note the percentage of down-regulated genes is significantly higher on the autosomes than on the X Chromosome regardless of whether the genes are located within or outside the introgressions, whereas no significant enrichment is found for up-regulated genes. (*) P < 0.01, Fisher's exact test. (F,G) A pairwise comparison of overall expression in males between ZZY10307 (F) or ZZY10330 (G) and C. nigoni, respectively. Correlation coefficient (R) is indicated. (H) A pairwise comparison of overall expression in males between ZZY10307 and ZZY10330.


