
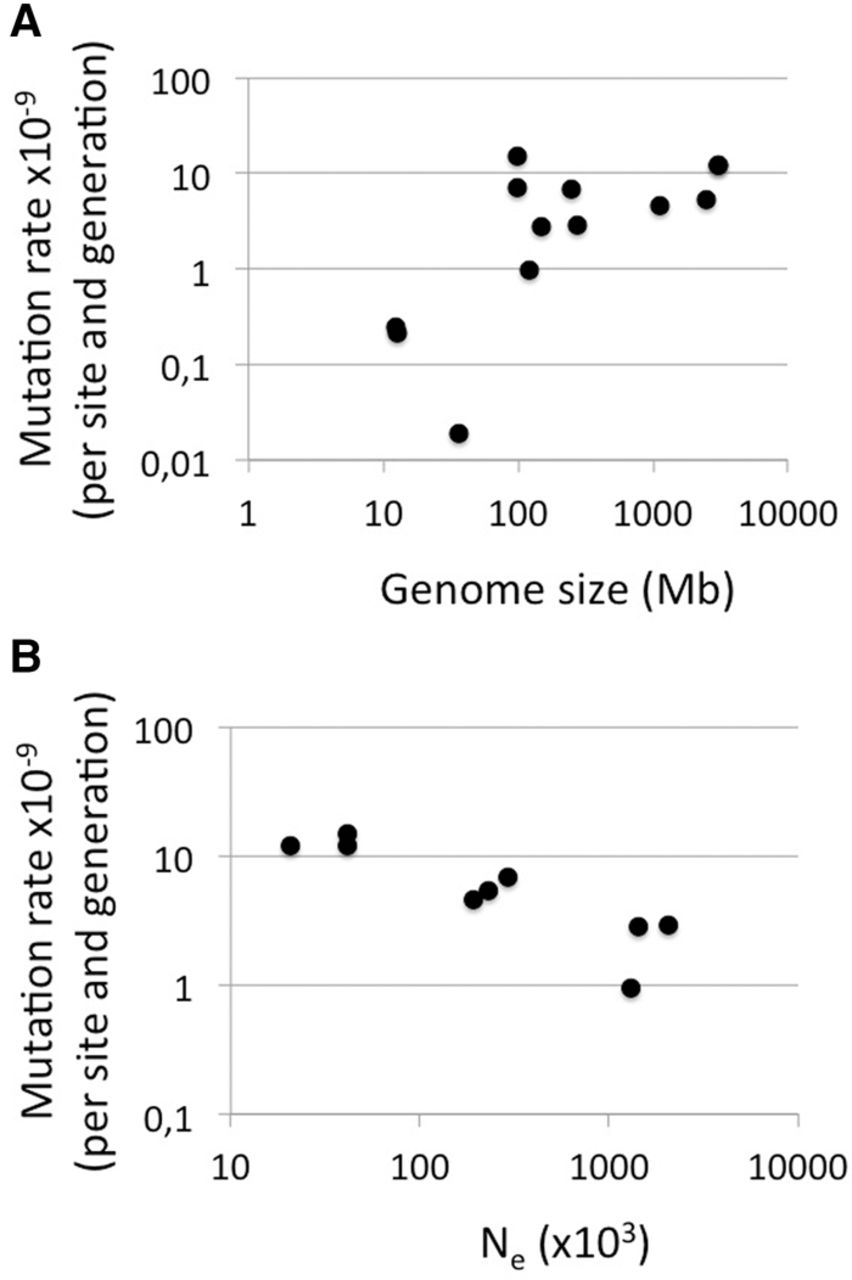
Relationship between mutation rate (per nucleotide and generation) and genome size (A) and effective population size (Ne) (B). Mutation rate estimates were taken from Table 2 and the references cited therein. Genome size is the length of assembled genome sequence as available at http://www.ncbi.nlm.nih.gov. For B, the species are in order of increasing Ne: Homo sapiens (π used to estimate Ne from the International SNP Map Working Group 2001), Pan troglodytes (The Chimpanzee Sequencing and Analysis Consortium 2005), Caenorhabditis elegans (Cutter et al. 2009), Ficedula albicollis (Burri et al. 2015), Mus musculus (Lindblad-Toh et al. 2000), Apis mellifera (Wallberg et al. 2014), Chlamydomonas reinhardtii (Flowers et al. 2015), Drosophila melanogaster (Andolfatto 2001), and Heliconius melpomene (Keightley et al. 2015).


