
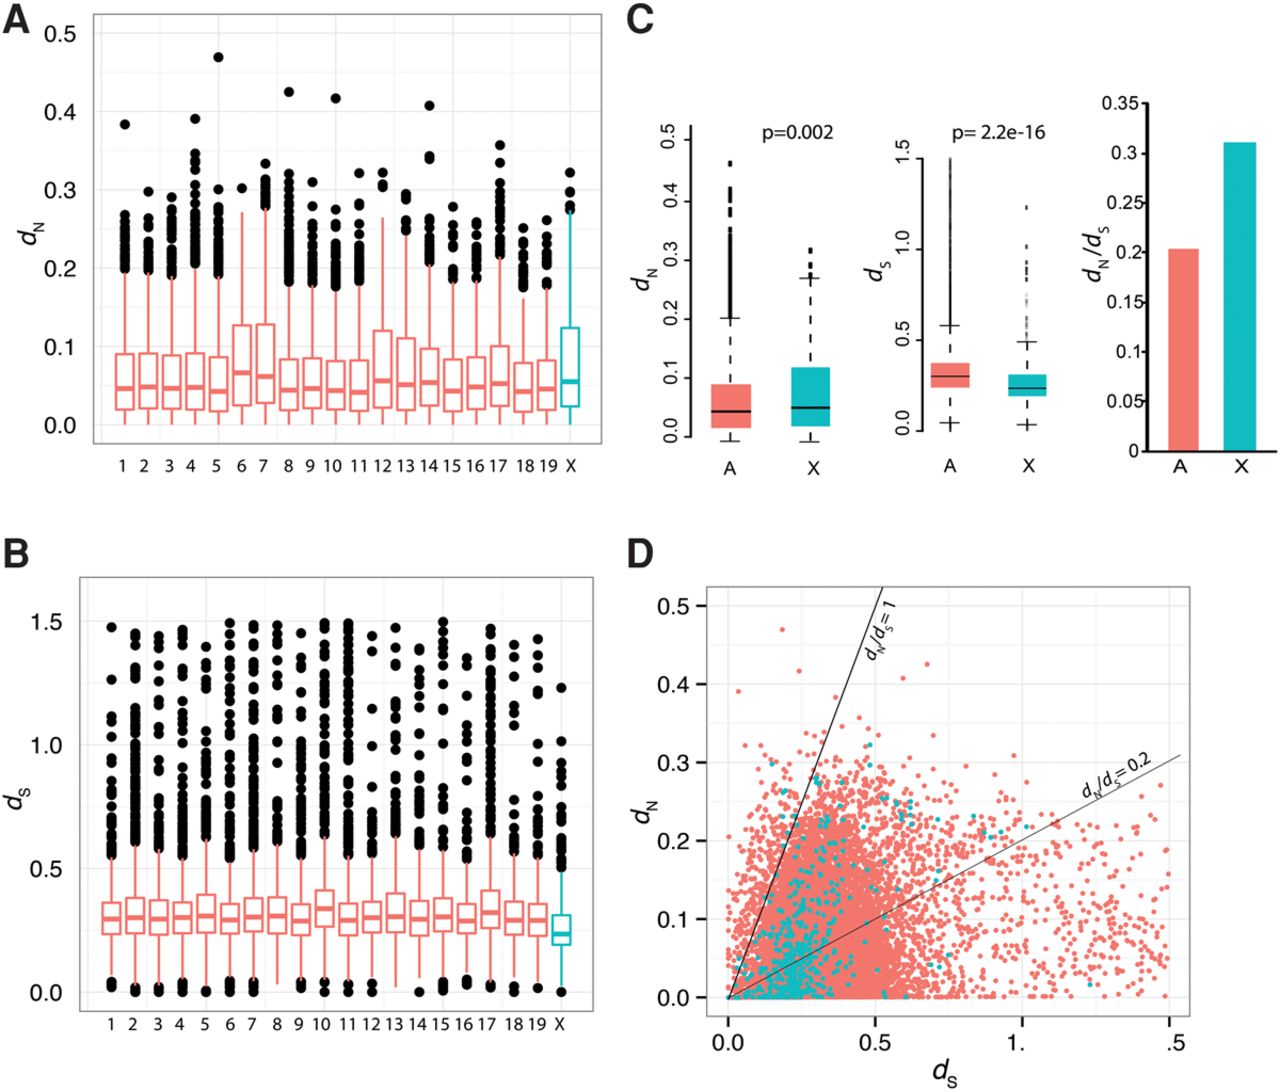
dN and dS analyses of autosomal and X-linked genes in E. lutescens. (A) Boxplots showing dN values of autosomal and X-Chromosomal E. lutescens orthologs of mouse genes. Values were averaged per chromosome and plotted using the mouse chromosomal map. (B) Boxplots showing dS values of autosomal and X-Chromosomal E. lutescens orthologs of mouse genes. Values were averaged per chromosome and plotted using the mouse chromosomal map. (C) Boxplots of dN (left) and dS (middle) values of all autosomal genes together compared with the X Chromosome, and the corresponding dN/dS values for the autosomal genes and the X-linked genes (right), calculated from the summed values. P values were calculated using R (Wilcoxon rank-sum test) and indicate significant differences between autosomal and X-Chromosomal values. (D) Scatter plot showing the distribution of dN and dS for the E. lutescens X Chromosome (green) and autosomes (red).


