
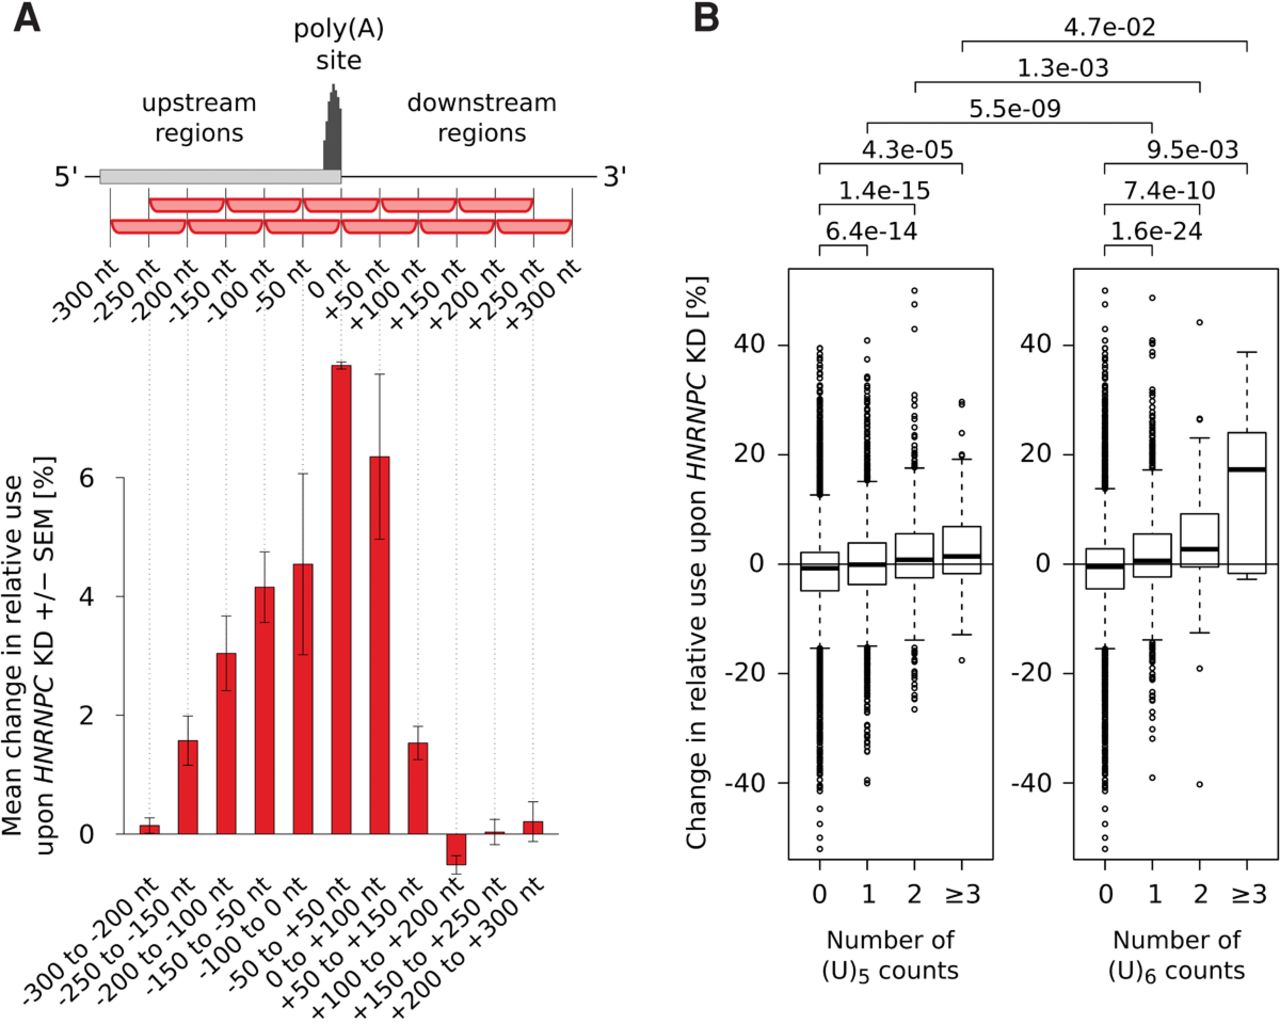
The length, number, and location of poly(U) tracts with respect to poly(A) sites influence the change in poly(A) site use upon HNRNPC knock-down. (A) Mean change in the use of sites containing the highest number of (U)5 motifs within 100-nt-long regions located at specific distances from the cleavage site (indicated on the x-axis) upon HNRNPC knock-down (KD). Shown are mean ± SEM in the two knock-down experiments. Two hundred fifty poly(A) sites with the highest density of (U)5 motifs at each particular distance were considered. (B) Mean changes in the relative use of poly(A) sites that have 0, 1, 2, or more (≥3) nonoverlapping poly(U) tracts within ±50 nt from their cleavage site. Distributions of relative changes in the usage of specific types of sites were compared, and the P-values of the corresponding one-sided Mann-Whitney U tests are shown at the top of the panel.


