
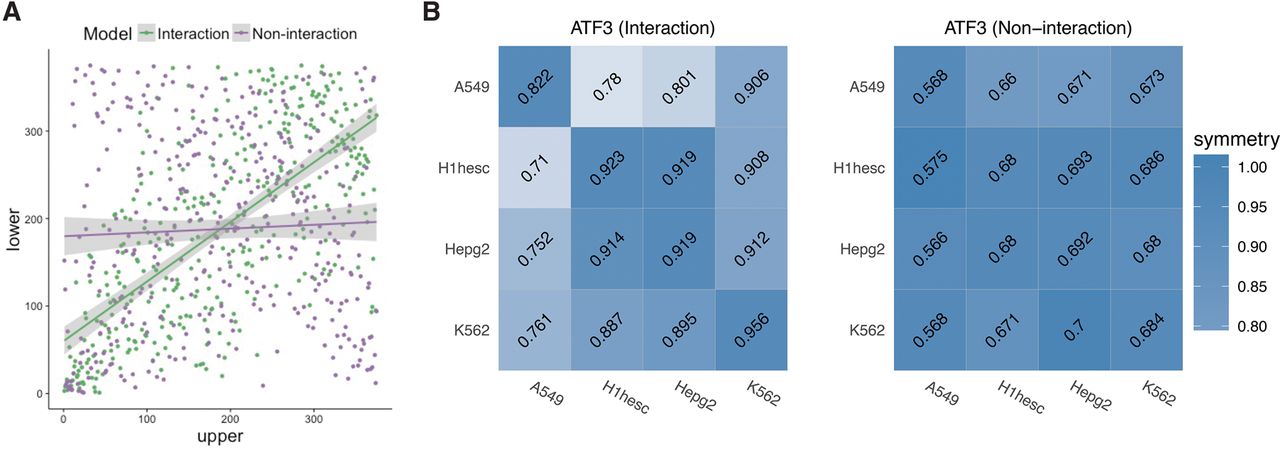
Figure 4.
Comparing cross-cell-type performance matrix of Interaction and NonInteraction models. (A) Ranks of the normalized symmetry of upper and lower diagonal matrices of cross-cell-type performance. Interaction and NonInteraction models are colored green and purple, respectively. (B) In each matrix, the row represents the cell on which the model is trained, and the column represents the cell from which the test data are used. Diagonal elements are within-cell-type performance, and each matrix is color-coded according to the extent of the nondiagonal element symmetry. The symmetry is calculated by normalizing each row by the reference model (diagonal element).


