
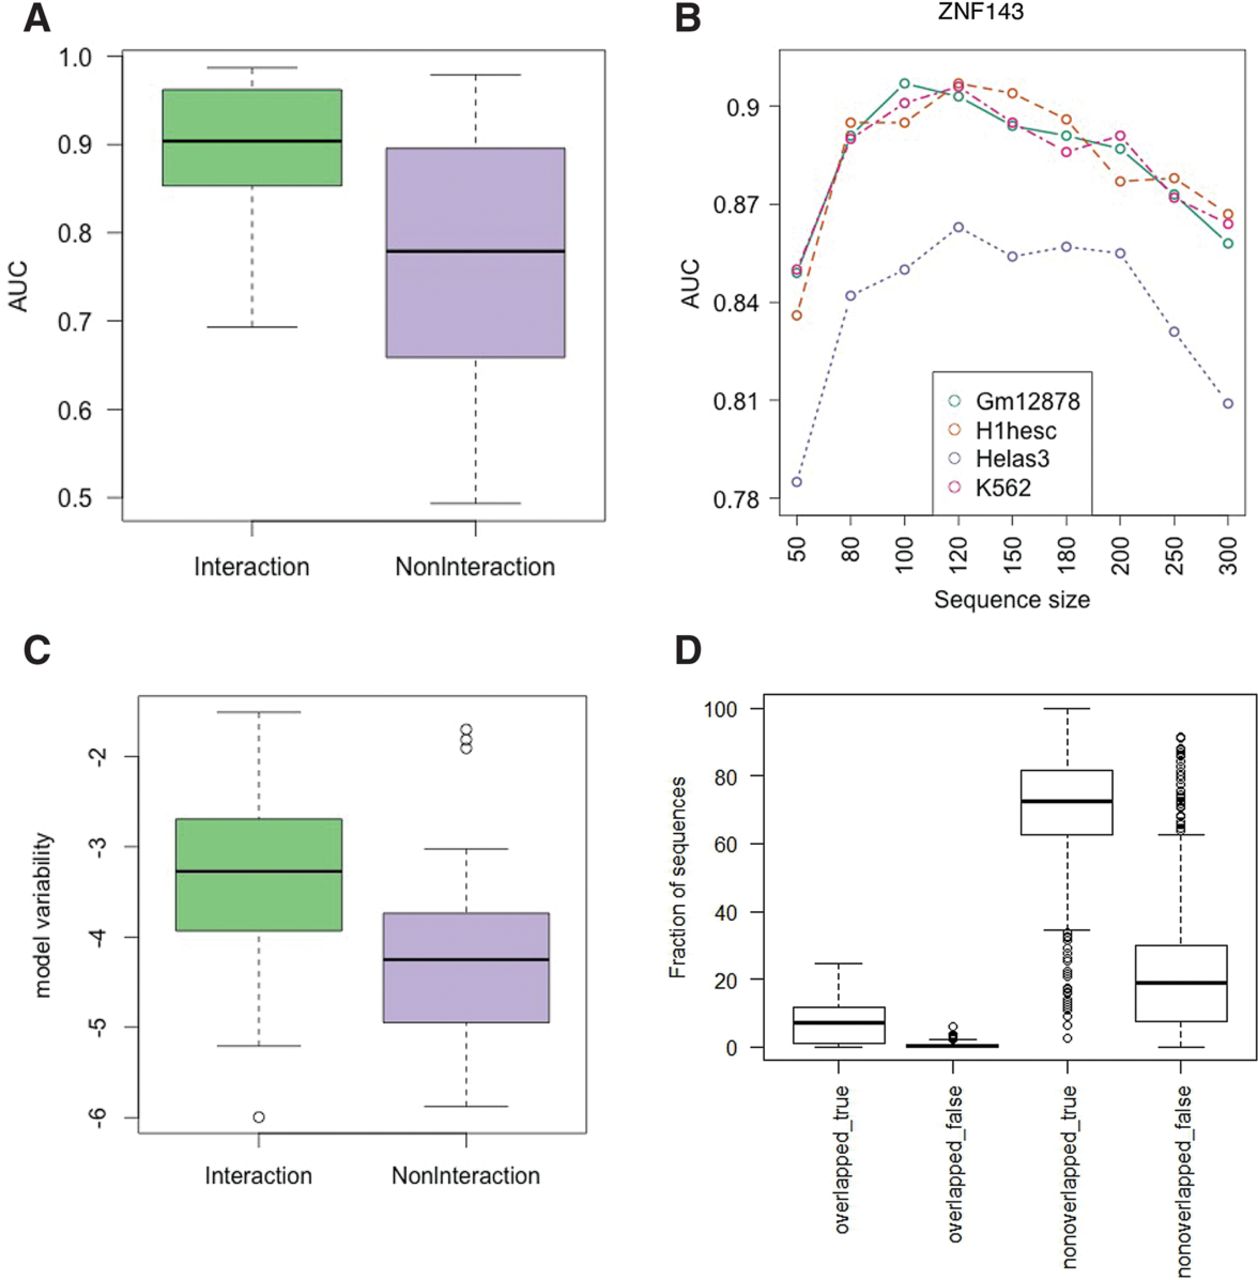
Association between the number of interaction partners and model accuracy. (A,C) Interaction and NonInteraction models are indicated with green and purple, respectively. (A) Comparison of cross-validation prediction accuracy for Interaction and NonInteraction models. (B) The trend of model accuracy with increasing sequence size for TF ZNF143 (selected arbitarily for illustration). Models from each cell line are indicated with different colors. (C) Comparison of model variability in log scale (variability of cross-cell-type performance for each model) for Interaction and NonInteraction models. (D) Distribution of the fraction of test sequences falling into one of the four categories: Overlapped_true denotes correctly and overlapped_false incorrectly classified sequences having at least 50% overlap between training sequences in one cell type and test sequences in another cell type. Nonoverlapped_true denotes correctly classified sequences that do not overlap with any sequence in the training set; nonoverlapped_false, incorrectly.


