
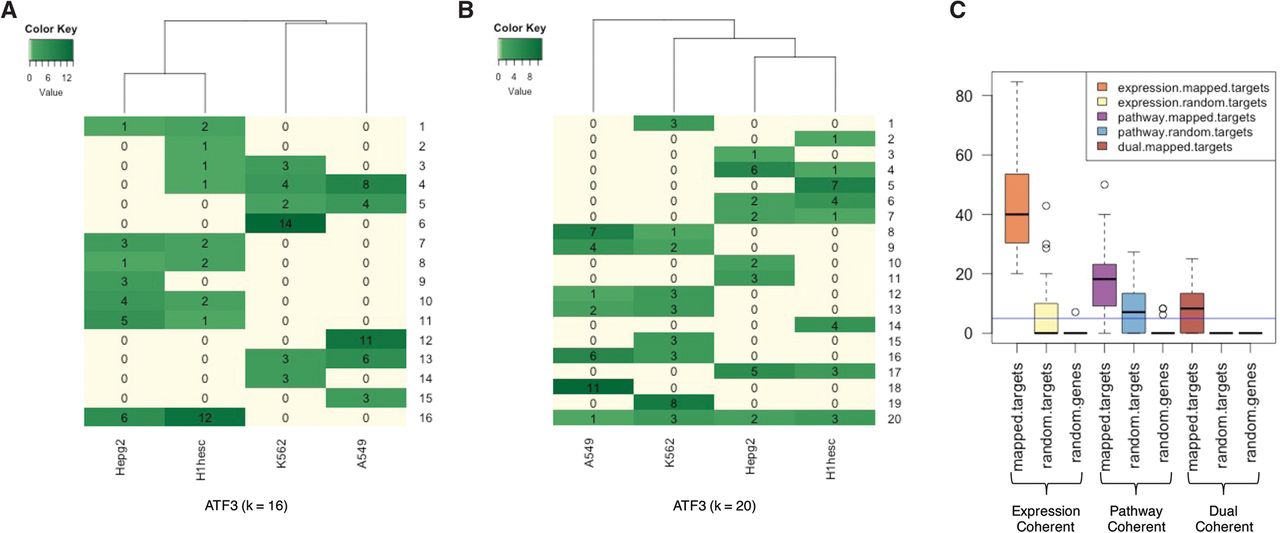
(A,B) Cluster membership matrix using a k-nearest neighbors algorithm (k-NN), where k = 16 (A) and k = 20 (B). Rows represent clusters and columns represent cell types. Each element in the matrix denotes the number of submodels in the cluster from each cell type. Some clusters consist of submodels from multiple cells (cluster 20 in B), while some others consist of submodels from a single cell type (cluster 6 in A). (C) Functional and expression coherence of submodel clusters: fraction of multi-cell-type clusters found to be coherent using k-NN. y-axis is the coherence percentage. Among the conditions (x-axis), mapped.targets denotes when genes are assigned to cluster based on TRISECT pipeline, random.targets indicates the clusters consisting of random genes among all targets, and random.genes indicates the cluster consisting of random genes. Here, expression coherence was defined using an expression threshold of log2CPM ≥ 1; i.e., a gene is considered expressed when the log2CPM ≥ 1. The horizontal line (blue color) denotes the coherence level of 5% of the total multi-cell-types.


