
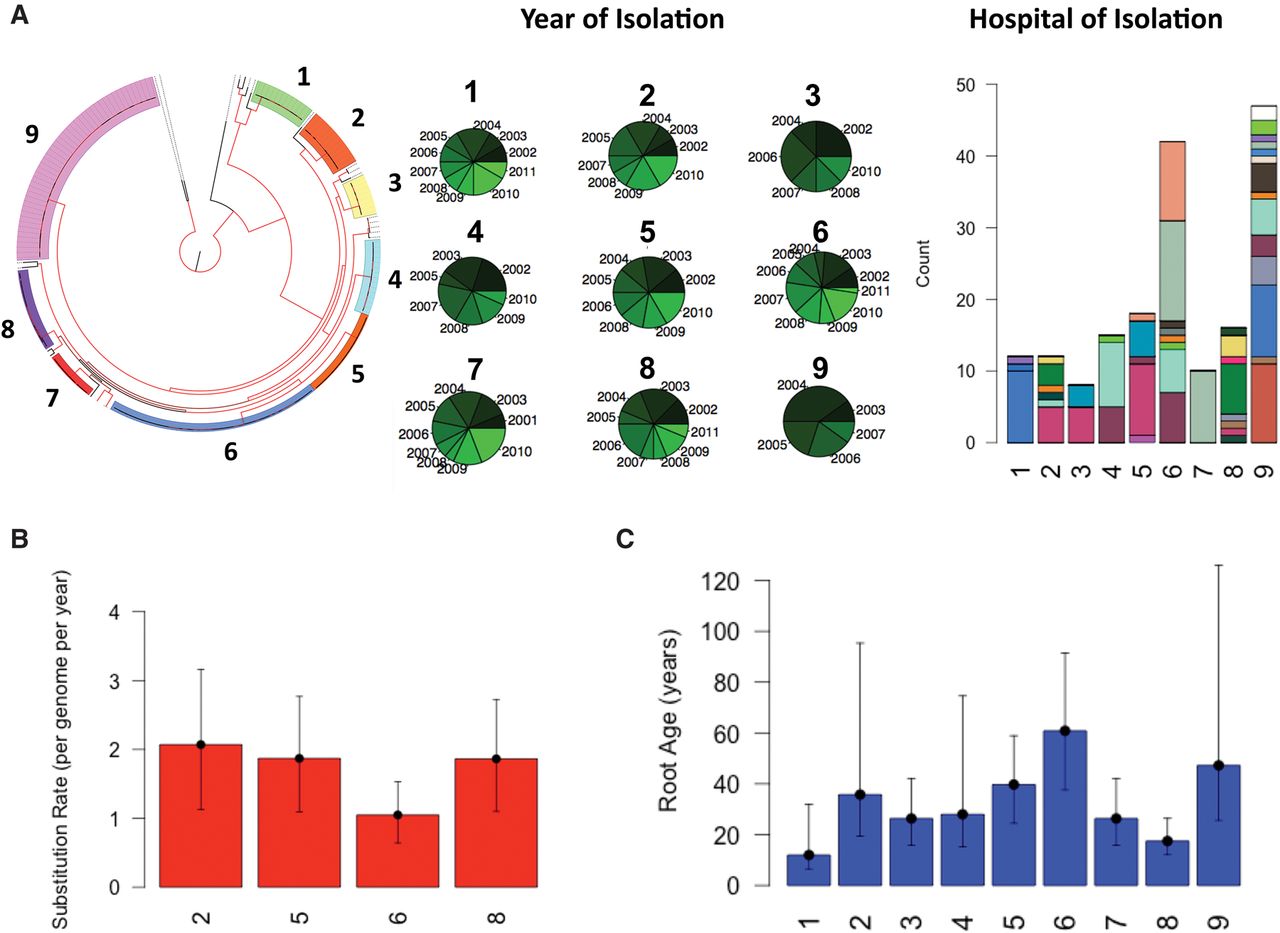
Temporal, geographical and phylogenetic clustering of isolates on the tree. (A) Phylogenetic tree with isolates colored according to cluster. The nodes with bootstrap support >90 are shown in red. The pie charts show the distribution of years of isolation and the color intensity corresponds to the temporal order, namely, the older the year of isolation the darker the color. The stacked bar plot shows the distribution of hospitals across the major clades on the phylogenetic tree. Each color corresponds to one hospital. (B) The estimated substitution rate for the clusters with significant temporal signal. Error bars show the 95% confidence intervals. The mutation rate is obtained by taking the average of three independent BEAST runs. (C) The estimated age of the MRCA for each cluster. Error bars correspond to 95% confidence interval for clusters shown in B. For the clusters without significant temporal signals, i.e., clusters 1, 3, 4, 7, and 9, we calculated the mean root age by using the mean substitution rate for clusters 2, 5, 6, and 8. For error bars, we considered the substitution rates obtained for maximum and minimum of 95% confidence intervals for clusters 2, 5, 6, and 8.


