
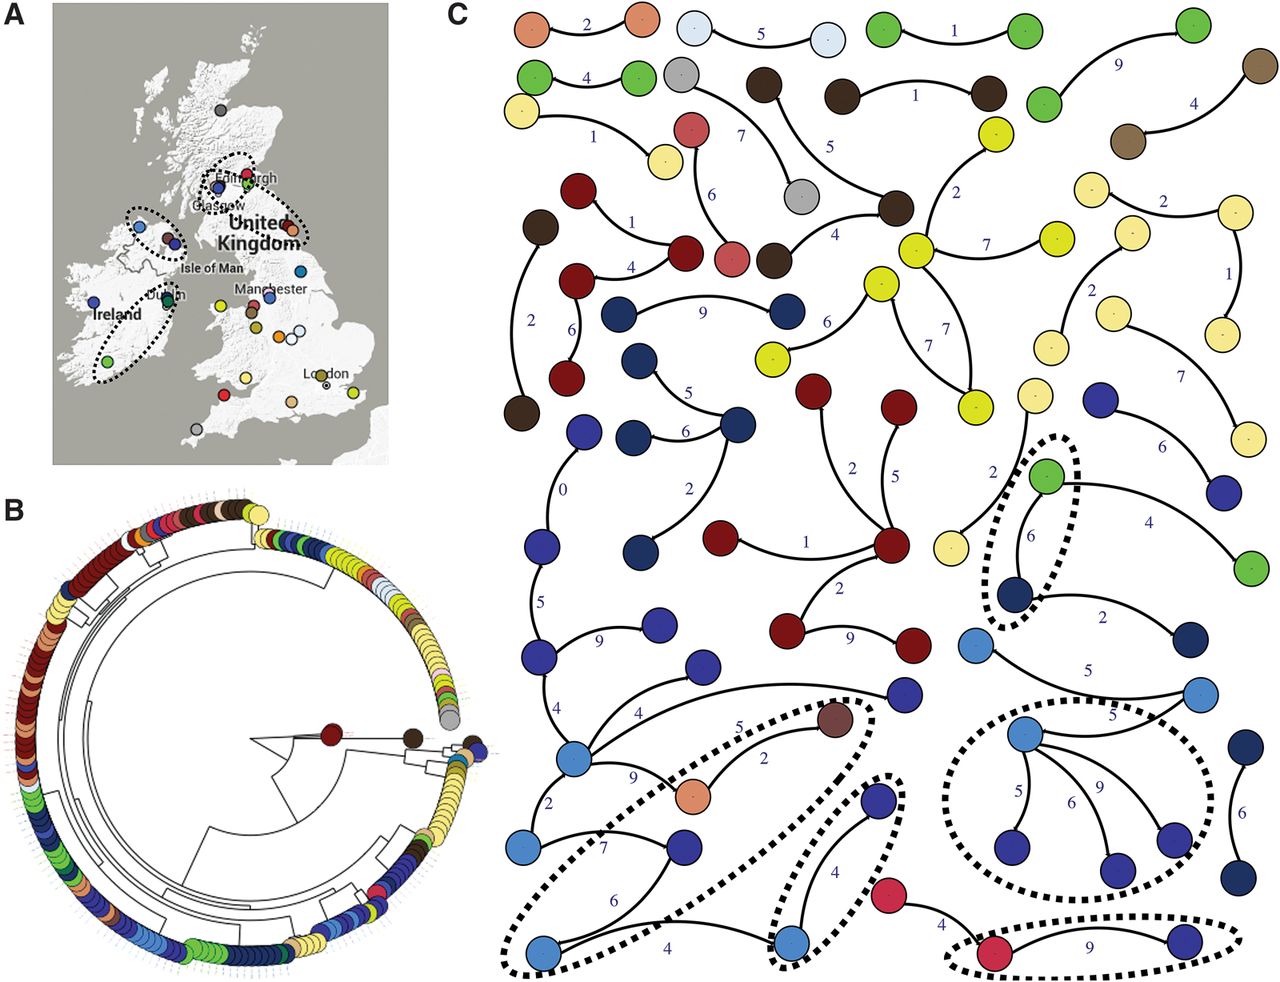
Figure 2.
Geographical distribution and transmission network analysis. (A) Isolation sites across the UK&I; (B) maximum likelihood tree with isolates colored according to location. (C) The transmission network constructed for potential transmission events. Only edges of <10 SNPs are displayed, and singleton nodes are not shown. Colors correspond to hospitals. Dashed circles show potential between-hospital transmissions and the locations of those hospitals on the map. The numbers next to edges denote pairwise SNP distance between isolates.


