
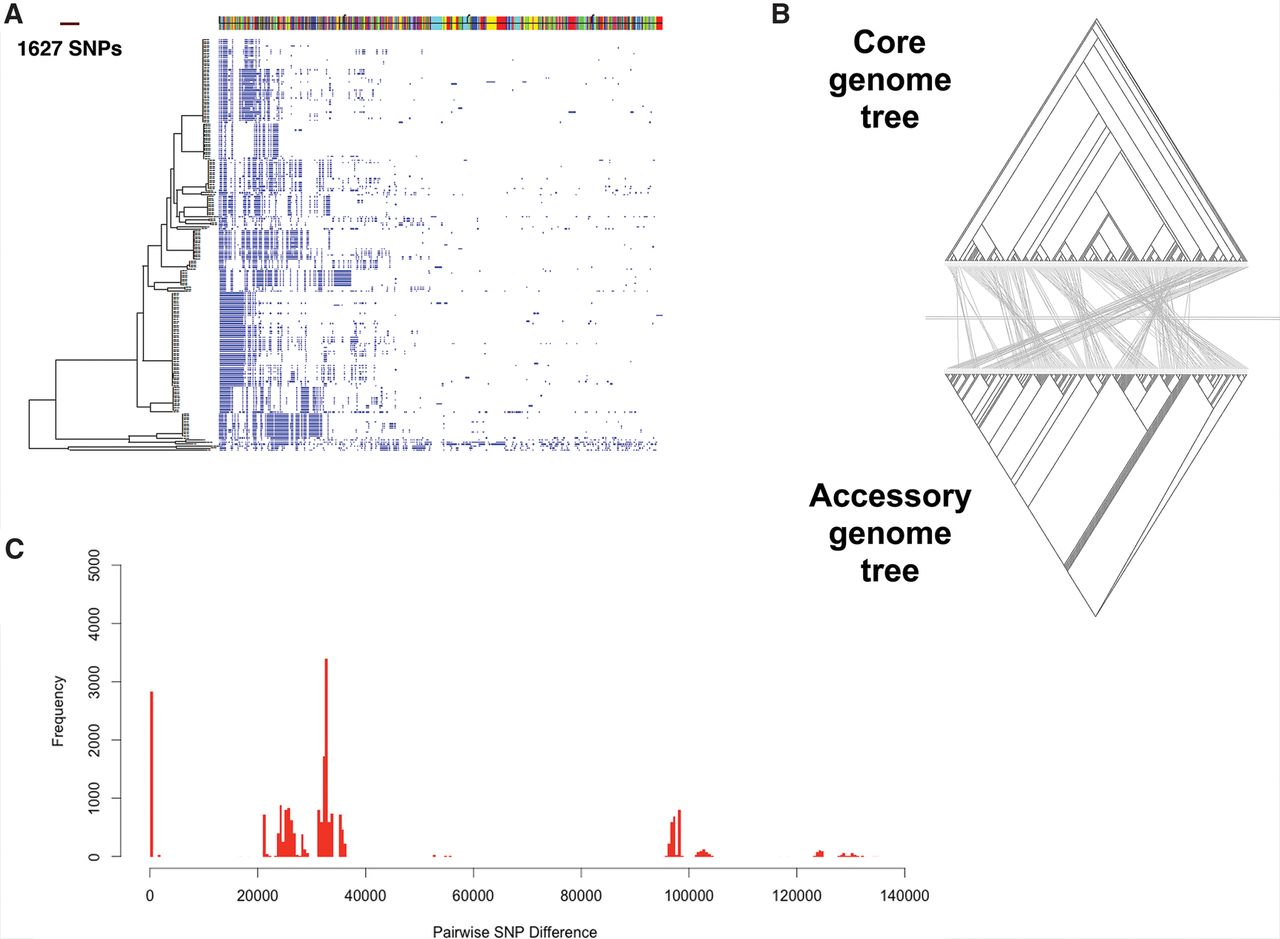
Pan-genome analysis of Serratia marcescens whole-genome sequences. (A) Maximum likelihood tree constructed from the core genome. On the right, the presence (blue) and absence (white) of accessory genome elements is shown. Accessory elements located on the same contig are shown as colored blocks along the top of the figure. (B) Comparison between the binary tree constructed from the absence and presence pattern of genes in the accessory genome (bottom) and the maximum likelihood tree constructed from variation in the core genome (top). The lines connect identical tips of the two trees. (C) A histogram of pairwise SNP distances between all 205 isolates. The distances are based on the core genome alignment.


