
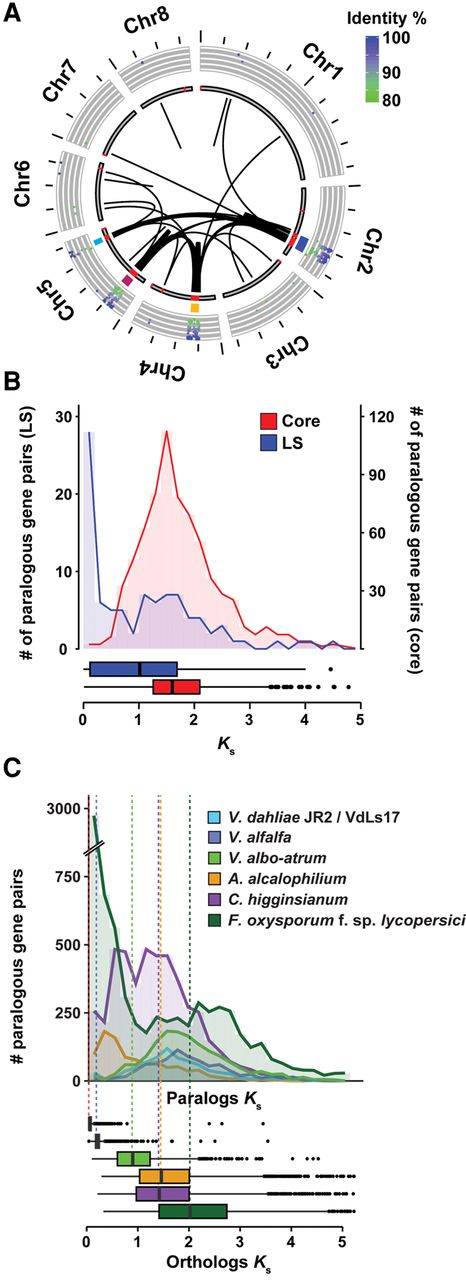
Whole-genome alignments of Verticillium dahliae strain JR2 reveals two duplication events. (A) Circos diagram illustrating sequence alignments within V. dahliae strain JR2. Black lines indicate genomic regions with sequence similarity. The inner circle shows LS regions (red lines), the middle circle indicates clusters of LS regions, and the outer circle shows the identity between pairs of secondary alignments. Each cluster of LS region is color coded: LS1 in blue, LS2 in yellow, LS3 in magenta, and LS4 in light blue (see Supplemental Table S2). (B) Ks distribution of paralogs of which both genes are located in the core genome (red) or at least one paralog is located in an LS region (blue). (C) Duplication events are estimated by calculating the Ks value for paralogous gene pairs and displayed in the line graph. Speciation events are estimated by calculating the Ks value for orthologous gene pairs based on genes from V. dahliae strains JR2 and their respective orthologs in the other genomes and displayed in the box plot. Distributions and median divergence times between 1:1:1 orthologous pairs, displayed by box plots, were used to estimate relative speciation events.


