
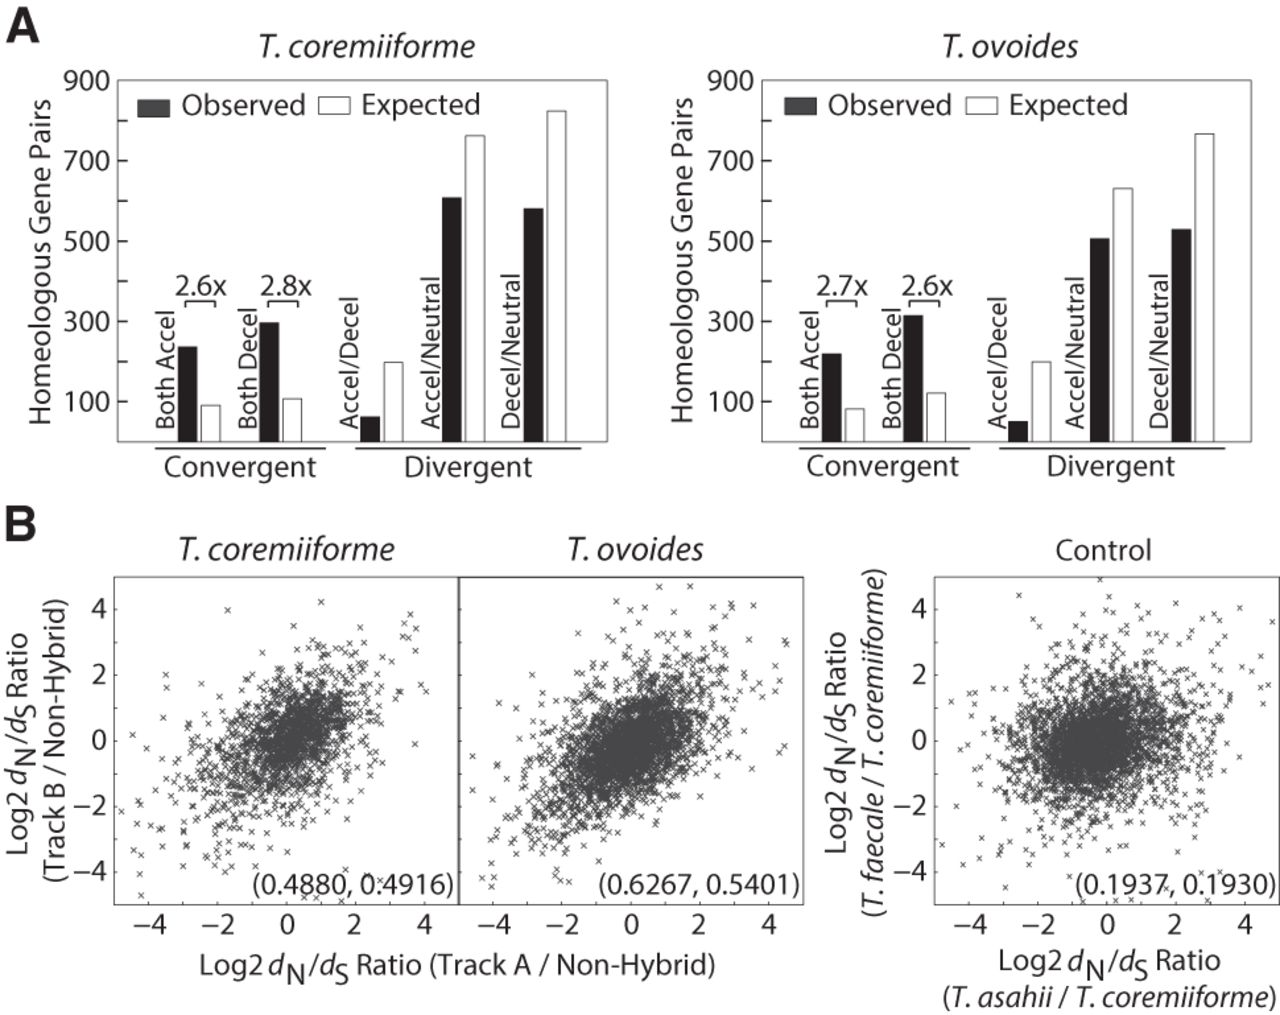
Convergent changes in evolutionary rates among hybrid homeologs. (A) Bar plots showing the enrichment of homeologous gene pairs with varying patterns of changes in evolutionary rates. The number of expected gene pairs in each class is based on the global frequency of accelerated/neutral/decelerated genes and the assumption that each gene of a homeologous pair independently became accelerated/neutral/decelerated. Only gene pairs with convergent changes (both accelerated or both decelerated) are enriched. Numbers followed by multiplication signs indicate the fold differences in gene pairs between observed and expected. (B) Scatterplots showing the correlation between dN/dS ratios of homeologous genes. Numbers in the parentheses indicate Pearson's and Spearman's correlation coefficients in that order. Control data set was created from the dN/dS ratio between T. asahii, T. faecale, and T. coremiiforme (average between subgenome A and B) as indicated. This represents the background level of correlation in evolutionary rate changes across closely related genomes but outside the context of hybridization.


