
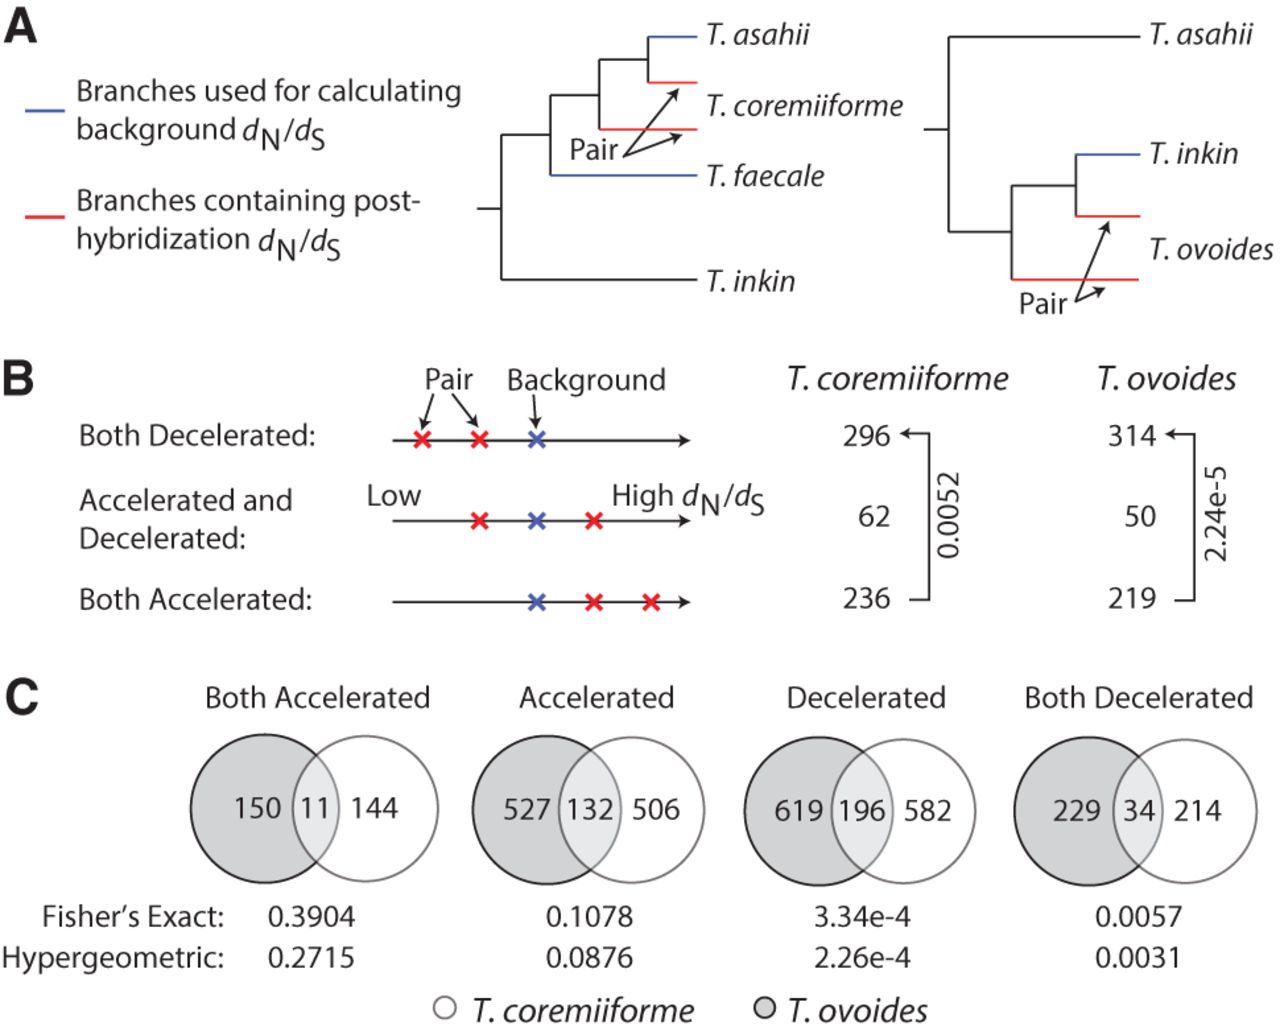
Deceleration of evolutionary rates following genome hybridization. (A) Diagram illustrating how background dN/dS are defined. Background dN/dS are calculated as the weighted average of dN/dS on the phylogenetic tree branches leading to nonpolyploid species (blue branches, weighted by branch dS). dN/dS ratios are then calculated as the ratio of dN/dS of the branches leading to hybrid species (red branches) over the background dN/dS. (B) The number of homeologous gene pairs with varying patterns of acceleration or deceleration in evolutionary rates. The threshold for calling genes as evolutionarily accelerated or decelerated is ±twofold in dN/dS ratio. Arrows and labels indicate the directions of enrichment and the binomial test P-values (under the null hypothesis that a gene pair is equally likely to become evolutionarily accelerated or decelerated). (C) Overlap of evolutionarily accelerated and decelerated homeologous gene pairs between the two hybridization events. The “accelerated” group consists of accelerated/accelerated and accelerated/neutral pairs. The “decelerated” group consists of decelerated/decelerated and decelerated/neutral pairs. The number of gene pairs in each species and the overlap size are shown. Fisher's exact test and hypergeometric test P-values are indicated below each comparison.


