
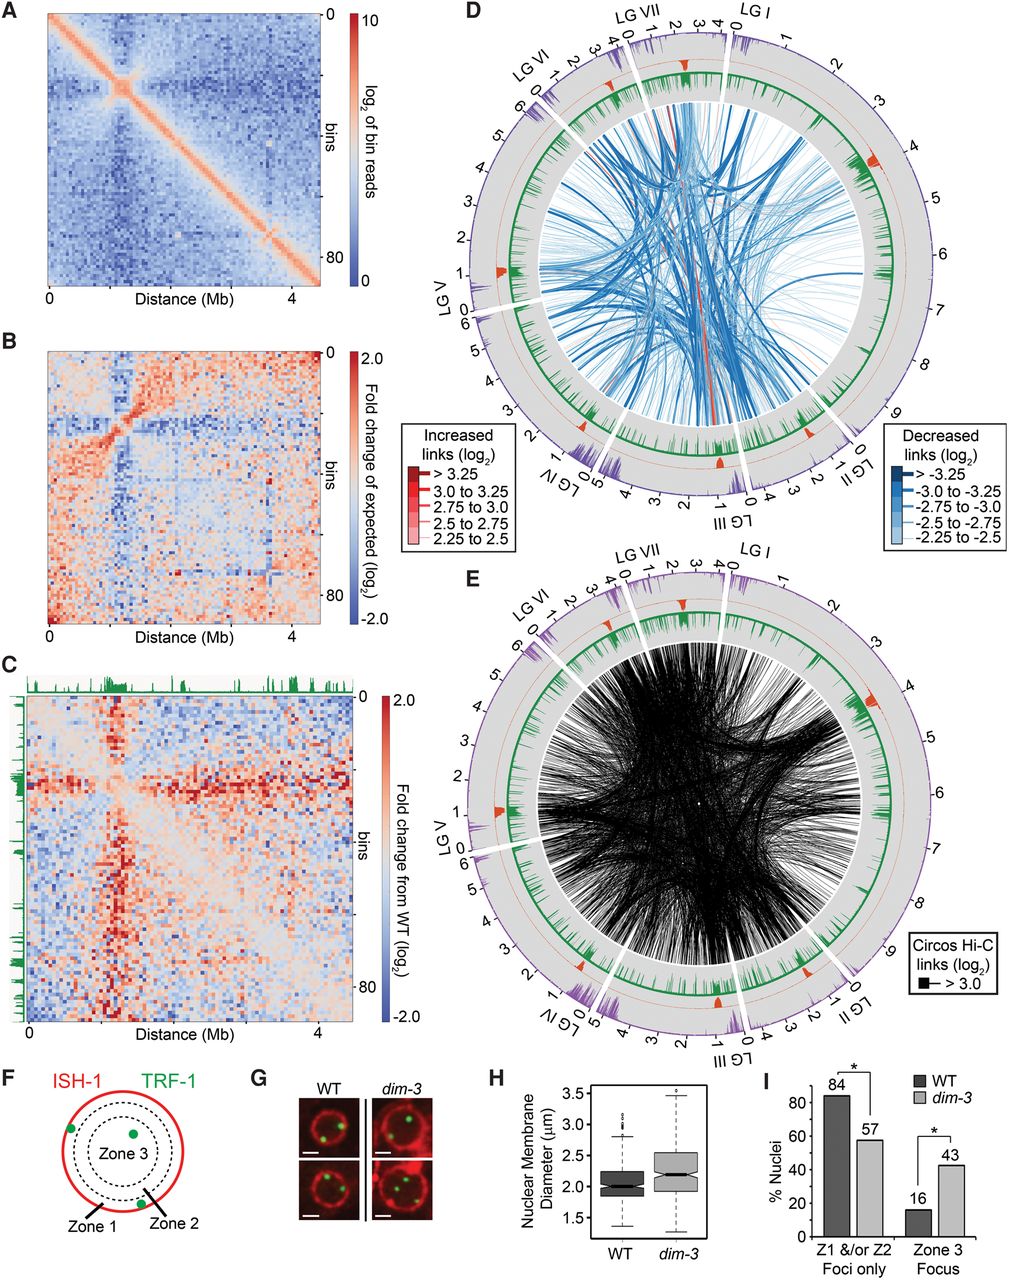
Defective importin alpha (DIM-3) causes altered chromatin conformation. (A) Heatmap of observed contacts (log2) within LGII in dim-3 at 50-kb resolution. (B) Heatmap of LGII showing the ratio (log2) between the observed frequency of interaction and the median frequency at each genomic position in the dim-3 strain. (C) Heatmap showing the fold change in observed versus expected contact frequencies (log2) of LGII between the dim-3 and WT strains. WT levels of H3K9me3 are displayed in green. (D) Circos plot of the largest changes in inter-chromosomal interaction frequencies in dim-3 and WT strains. To normalize data set depths, 16.5 million read pairs were randomly selected from the WT data set and compared to the entire dim-3 data set. Regions with increased interaction frequencies are in red, whereas regions with decreased frequencies are in blue; different line thicknesses were used to convey differences in the absolute magnitude of the changes. Although WT H3K9me3 (green), CenH3 (orange), and H3K27me2/3 (purple) histograms are shown, a dim-3 strain has a large reduction of H3K9me3 (Klocko et al. 2015). (E) Circos plot displaying all strong (log2 > 3.0) inter-chromosomal chromatin interactions after normalizing for genomic distance within the dim-3 strain, as in Figure 1D. (F) Schematic depicting the division of the nuclear space into three zones (1–3) of equal area for the categorization of telomeric foci (green; TRF-1-GFP) relative to the nuclear membrane (red; ISH-1-BFP). (G) Two examples of nuclei from WT (left) and dim-3 (right) strains expressing TRF-1-GFP foci and ISH-1-BFP. Each scale bar is 1 µm. (H) Box plot showing nuclear membrane diameter (μm) of WT (dark gray; n = 324 nuclei) and dim-3 (light gray; n = 366 nuclei) strains. Mean and variance of nuclear membrane diameter for WT is 2.05 μm ± 0.1 and 2.25 μm ±0 20 for dim-3; P = 5.6 × 10⁻¹¹ (ANOVA test). (I) Graph showing the percentage of WT (dark gray; n = 324 total nuclei) or dim-3 (light gray; n = 366 total nuclei) nuclei with telomeric foci in only Zone 1 or Zone 2 (left) or containing at least one Zone 3 telomeric focus (right). Note that since dim-3 nuclei often contained multiple foci in Zone 3, this tally may underestimate the total number of decoupled telomeres. Asterisks denote significant changes (P < 0.01; nuclei with foci in Zone 1 and/or Zone 2 only P-value = 3.7 × 10⁻⁵; nuclei with foci in Zone 3 P-value = 3.9 × 10⁻¹⁰; χ2 test); P-value = 6.7 × 10⁻¹⁴ (χ2 test) of all Zone differences between WT and dim-3.


