
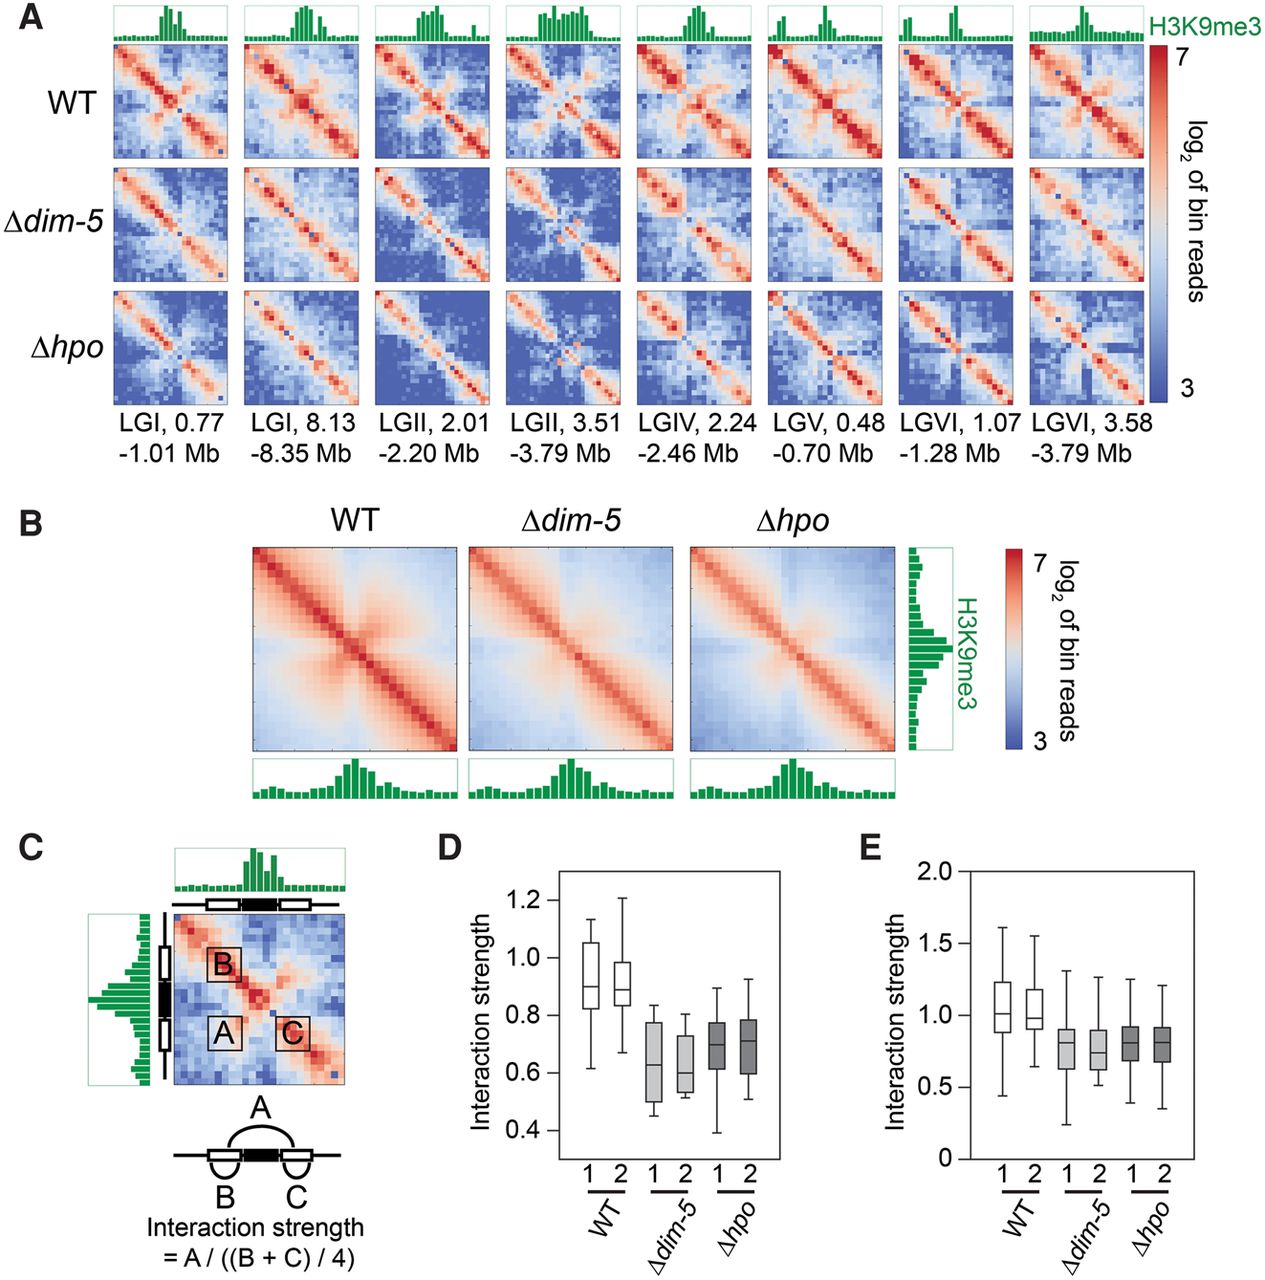
Interactions between flanks of interspersed heterochromatic regions are reduced in Δdim-5 and Δhpo. (A) Heatmaps showing contact frequencies (log2) around eight interspersed heterochromatic regions in WT, Δdim-5, and Δhpo. Levels of WT H3K9me3 enrichment are shown in green. Examples were chosen to illustrate changes between mutants and WT (see also D,E). (B) Heatmaps showing the average signal surrounding all heterochromatic regions in WT, Δdim-5, and Δhpo strains, produced by script plotHetStack.py. Levels of WT H3K9me3 enrichment are shown in green. (C) The signal in box A corresponds to interactions between heterochromatin flanks and was normalized to box B and C signals to account for any differences in data depth between strains. (D) Box plot showing contact frequency quantifications (log2) of the eight examples in A for two replicates of WT, Δdim-5, and Δhpo strains, produced by script getHetFlankInteractions.py. (E) Box plot showing contact frequency quantification (log2) of all examples in the genome for two replicates of WT, Δdim-5, and Δhpo strains, produced by script getHetFlankInteractions.py.


