
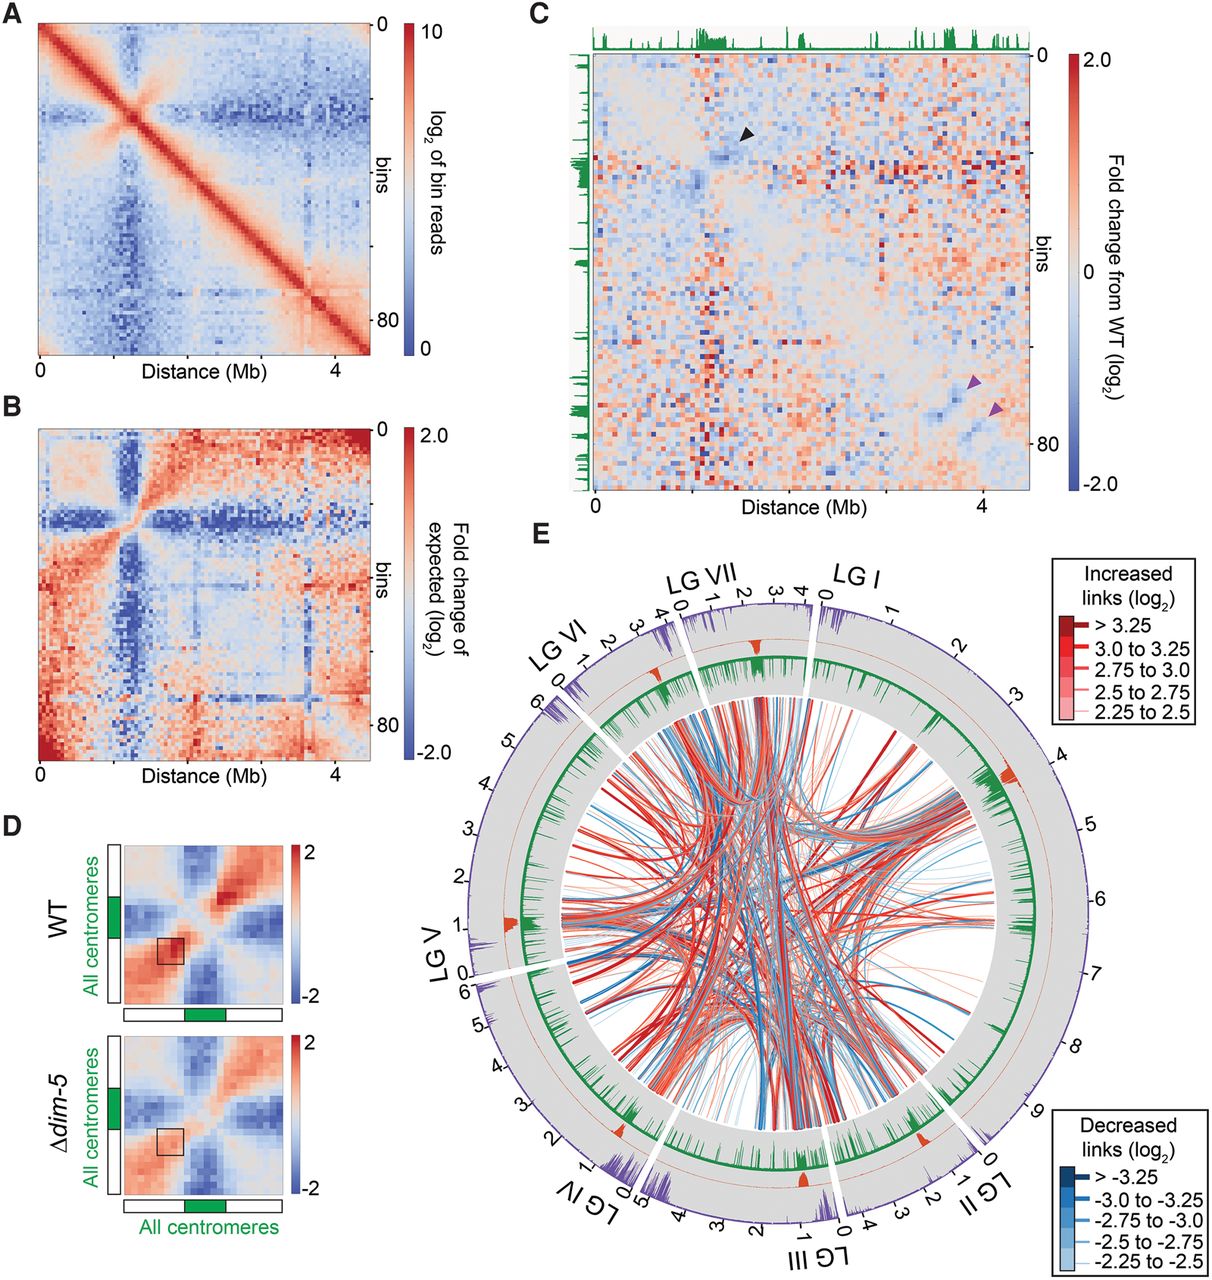
Reduced interactions between heterochromatin flanks in a strain lacking the H3K9 methyltransferase, DIM-5. (A) Heatmap of observed contacts (log2) within LGII in a Δdim-5 strain at 50-kb resolution. (B) Heatmap of LGII showing the ratio (log2) between the observed and expected (median at each genomic position) frequency of interactions in a Δdim-5 strain. (C) Heatmap showing the fold change (log2) in contact frequencies on LGII between the Δdim-5 and WT strains. Levels of H3K9me3 observed in the WT strain are displayed in green. Black arrowhead marks decreased pericentromeric contacts, and purple arrowheads mark decreased interactions of interspersed heterochromatic flank regions. (D) Heatmaps of the combined observed versus expected ratios of all seven centromeres in WT (top) and Δdim-5 (bottom), generated with the script plotCentromeres.py. Boxes indicate interactions between euchromatic regions bordering pericentromeres. (E) Circos plot of the largest changes in inter-chromosomal interaction frequencies in Δdim-5 versus WT strains; each data set contained 30 million reads to yield equivalent numbers of filtered reads. Regions with increased or decreased interaction frequencies are in red or blue, respectively. Line thickness corresponds to magnitude of the changes. Histograms display the WT enrichment of H3K9me3 (green), CenH3 (orange), and H3K27me2/3 (purple); the Δdim-5 strain has no H3K9me3 (Tamaru and Selker 2001) and reduced occupancy of CenH3 at most centromeres (Smith et al. 2011).


