
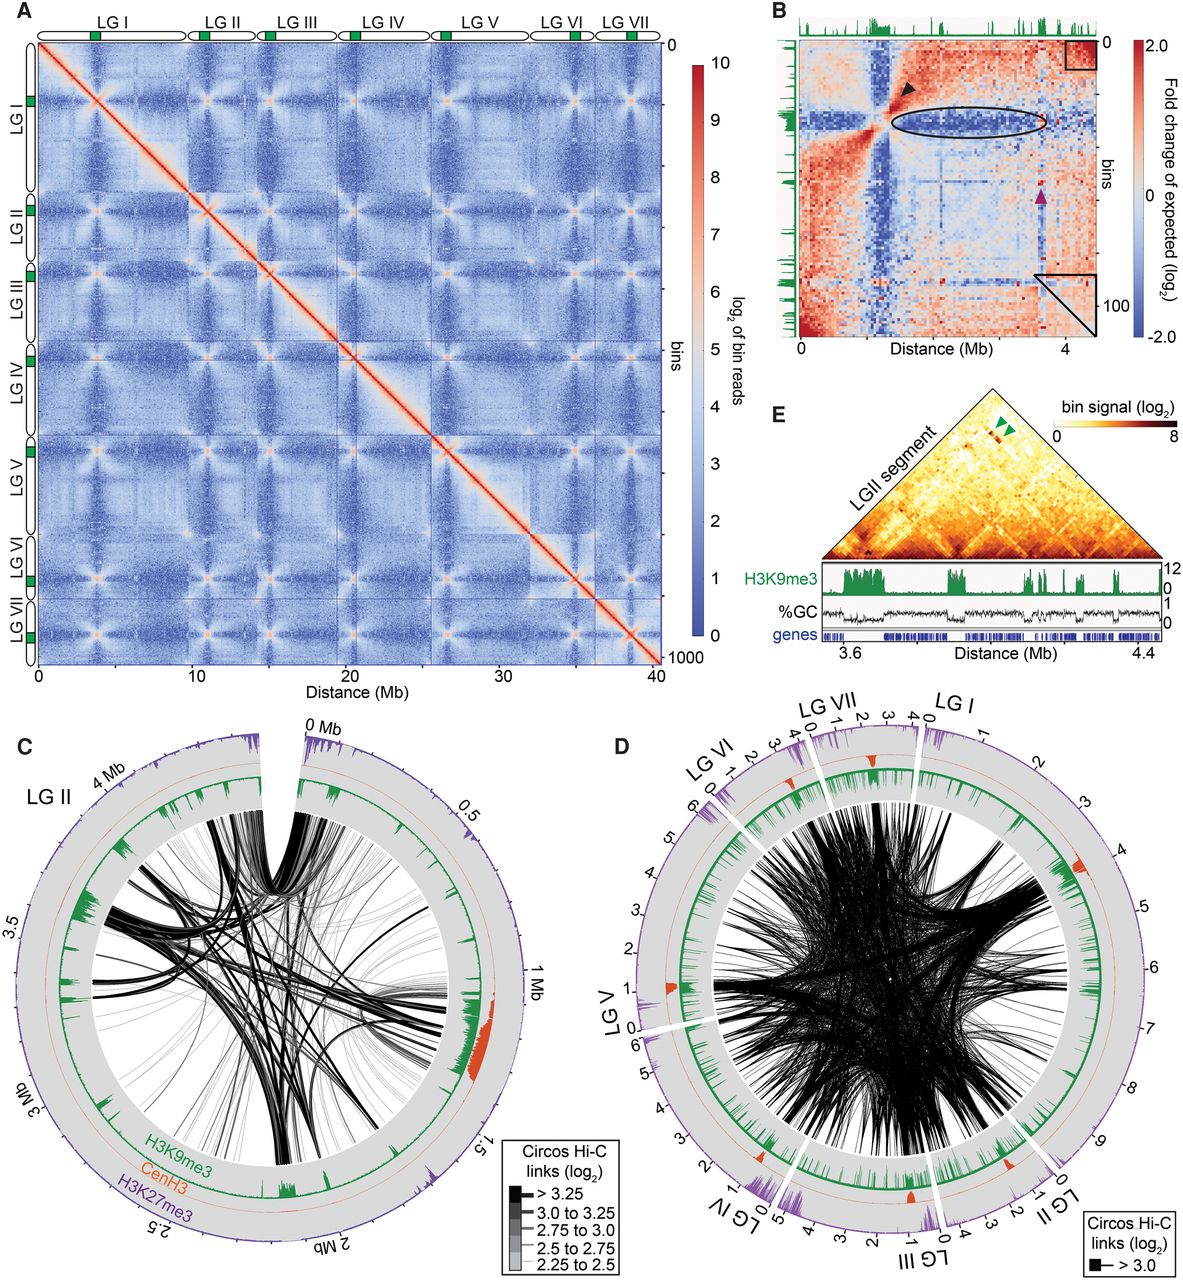
The Neurospora genome is organized in three-dimensional space. (A) Heatmap showing observed contacts (log2) between binned 40-kb regions of the ∼43 Mb N. crassa genome (1013 bins). The seven chromosomes (linkage groups LGI–LGVII) are indicated with elongated ovals next to the heatmap; green bars mark the centromeres. Frequent local interactions emerge as intense red signals along the diagonal. Strong intra- and inter-chromosomal contacts between centromeres (white to orange “X” patterns) and subtelomeres are also evident. (B) Heatmap of the strongest intra-chromosomal contacts within LGII at 40-kb resolution after normalizing for genomic distance. H3K9me3 ChIP-seq tracks (green) are shown for reference. The black arrowhead indicates increased interactions between euchromatic flanks immediately bordering pericentromeres. The black box indicates increased interactions between the left and right subtelomeric regions, the purple arrowhead denotes interspersed heterochromatin, and the oval denotes a region with few contacts between the centromeric region and the right arm. The triangle marks the region highlighted in E. (C) Plot of the strongest intra-chromosomal contacts within LGII at 10-kb resolution after normalizing for genomic distance. Black links indicate contacts with a log2 enrichment ≥2.25. The line thickness indicates contact frequency. For this and subsequent Circos plots, H3K9me3, CenH3, and H3K27me2/3 enrichment in a WT strain are shown as green, orange, and purple histograms, respectively. Distance from the left telomere is indicated. (D) Plot of the strongest inter-chromosomal contacts at 10-kb resolution after normalizing for genomic distance. Black links indicate contacts with a log2 frequency ≥3.0. (E) Expanded heatmap of observed contacts (log2) within a ∼0.9 Mb region indicated by the triangle in B (3.55–4.45 Mb) at 10-kb resolution showing local interactions. Green arrowheads mark the enriched long-range interactions between heterochromatic regions.


