
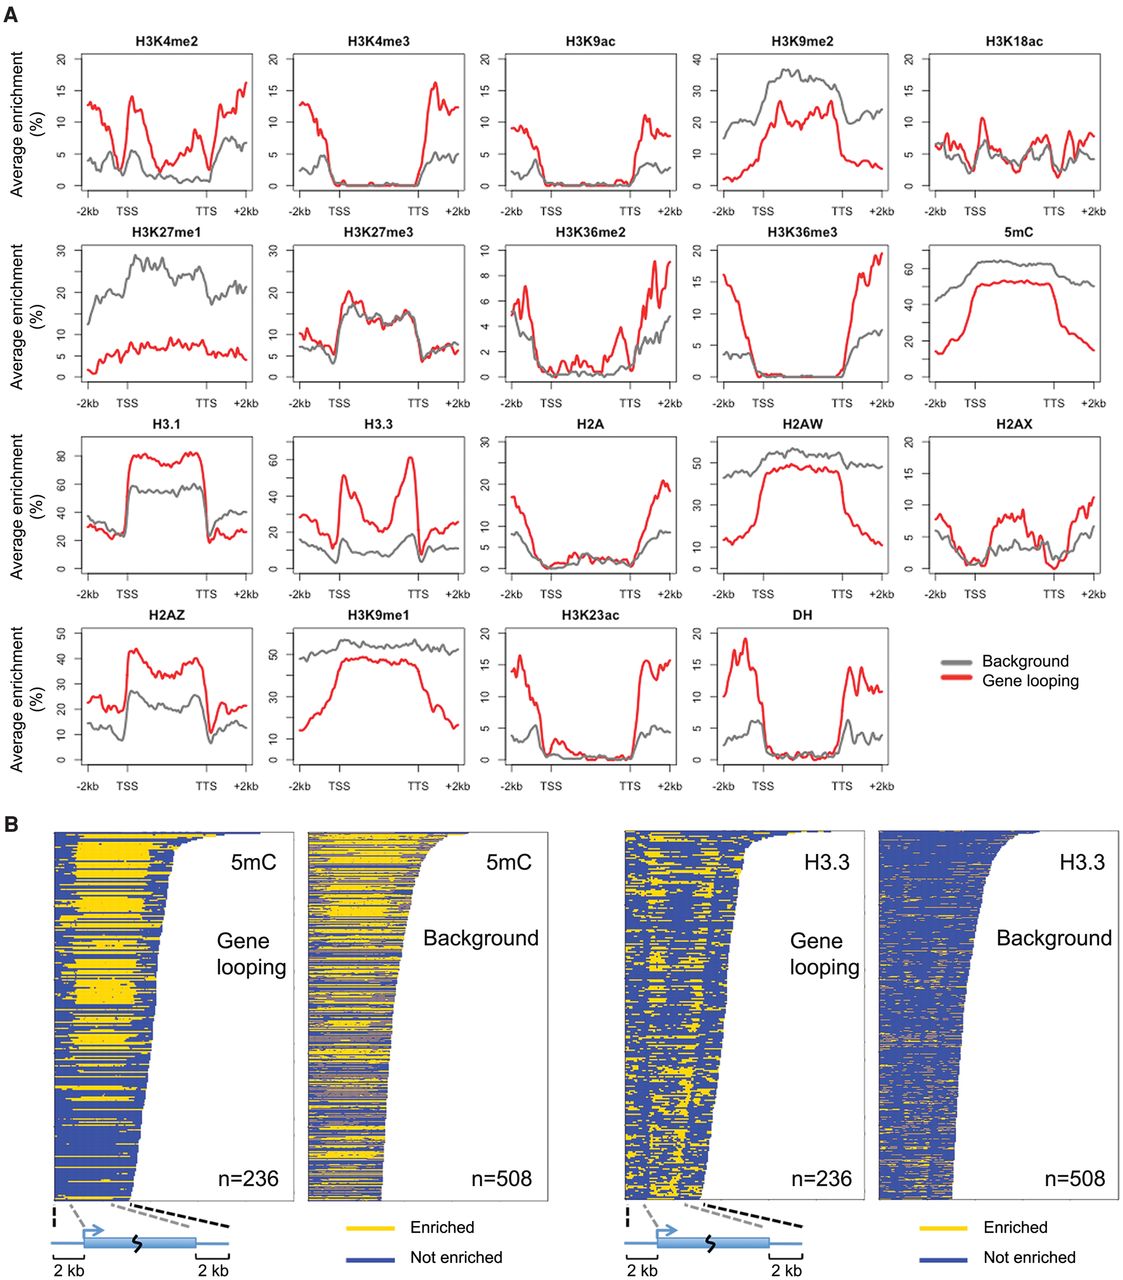
Figure 6.
Epigenetic features associated with silent genes having gene loop conformation. (A) Epigenetic marks around genes with expression level 1–3. Genes are scaled to align their TSSs and TTSs. Average enrichment means the percentage of regions (calculated from 100-bp windows) enriched for the respective epigenetic mark. (B) Enrichment of DNA methylation and H3.3 on individual genes shown in A.


