
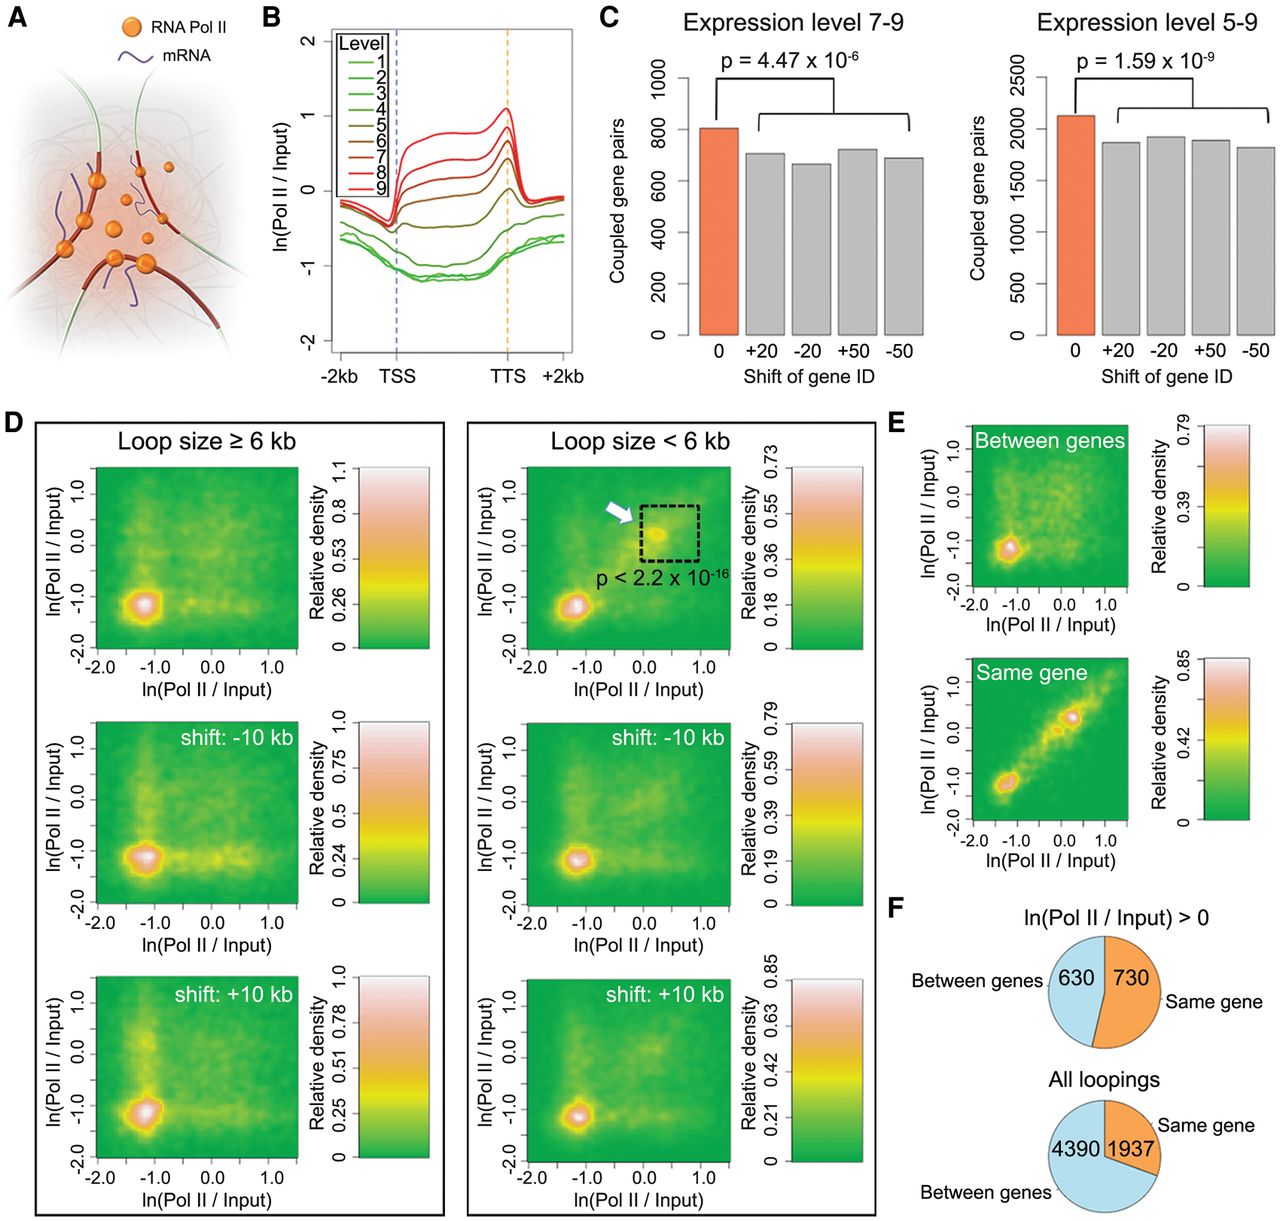
Coupling of expressed genes. (A) A cartoon of the transcription factory model. (B) Correlation between RNA Pol II binding and gene expression levels. Genes are scaled to align their TSSs and TTSs. (C) Coupled gene pairs that are actively expressed. The background (gray) was estimated by reassigning new expression levels to genes according to the values from the 20th or 50th genes upstream or downstream. Loops shorter than 6 kb were not considered. P-values indicate significance relative to the permutation-based null distribution of background. (D,E) Association of RNA Pol II with chromatin loops. The lower two plots in D always show controls where the coordinates of RNA Pol II signals (measured as the natural base logarithm of the ratio between normalized Pol II and input coverage) were shifted 10 kb up- or downstream. The P-value comes from testing for enrichment of loops in the highlighted square relative to a permutation-based null distribution of background, estimated by shifting Pol II signal coordinates ±10 kb and ±20 kb. The two panels in E only include loops shorter than 6 kb. See Figure 2C legend for more information. (F) Interactions between and within genes that are connected by chromatin loops with interacting partners that overlap gene bodies. The numbers indicate pairs of genes in each category. In both comparisons, only loops shorter than 6 kb were considered, and for RNA Pol II on top, only loops where both interacting partners were enriched for Pol II (having a signal/input ratio larger than 1) were selected.


