
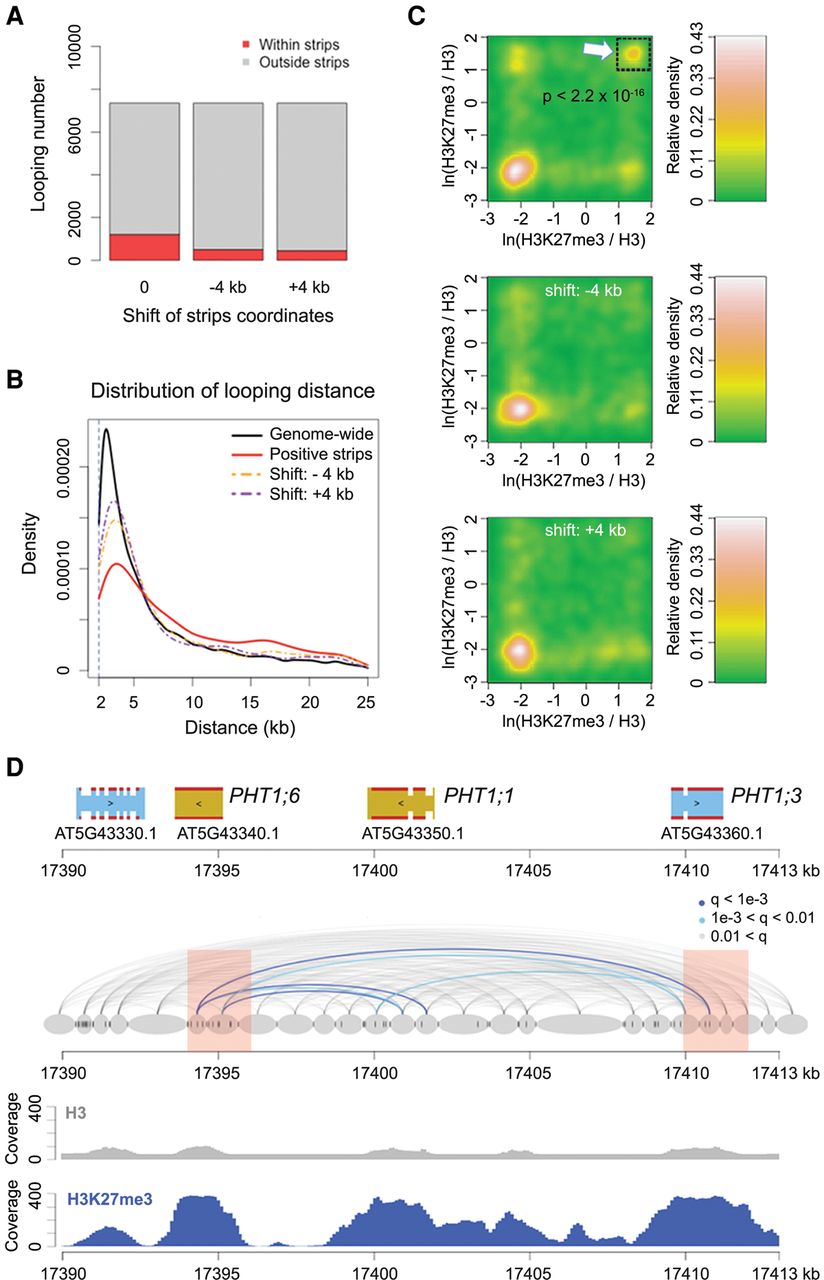
H3K27me3 and chromatin loops. (A) Proportion of chromatin loops related to “positive strips,” defined as regions with strong Hi-C interaction with neighboring chromatin (Wang et al. 2015). Loops shorter than 6 kb are not included. “−4k b” and “+4 kb” represent controls in which the coordinates of annotated positive strips were shifted 4 kb up- or downstream. (B) Chromatin loop sizes in regions overlapping with positive strips, compared with genome-wide background and shifted coordinates as in A. (C) Density of H3K27me3 on chromatin loops that have at least one interacting partner in positive strip regions. For each pair of interacting chromatin segments, the H3K27me3 signal on both segments was calculated as the natural base logarithm of the ratio between normalized H3K27me3 and H3 coverage. The distribution of these pairwise values is shown as a matrix of relative density, generated with the “bkde2D” function in the R software package “KernSmooth” (grid size = 80, bandwidth = 0.15). (Middle and bottom) Coordinates of positive strips are shifted as in A. The P-value comes from testing for enrichment of loops in the highlighted square relative to a permutation-based null distribution of background, estimated via shifting positive strip coordinates ±4 kb and ±8 kb. (D) Chromatin loops in a region with three PHT1 genes. Positive strip regions are highlighted in pink. Normalized H3 and H3K27me3 ChIP-seq coverages are shown below. See Figure 1A for additional annotation.


