
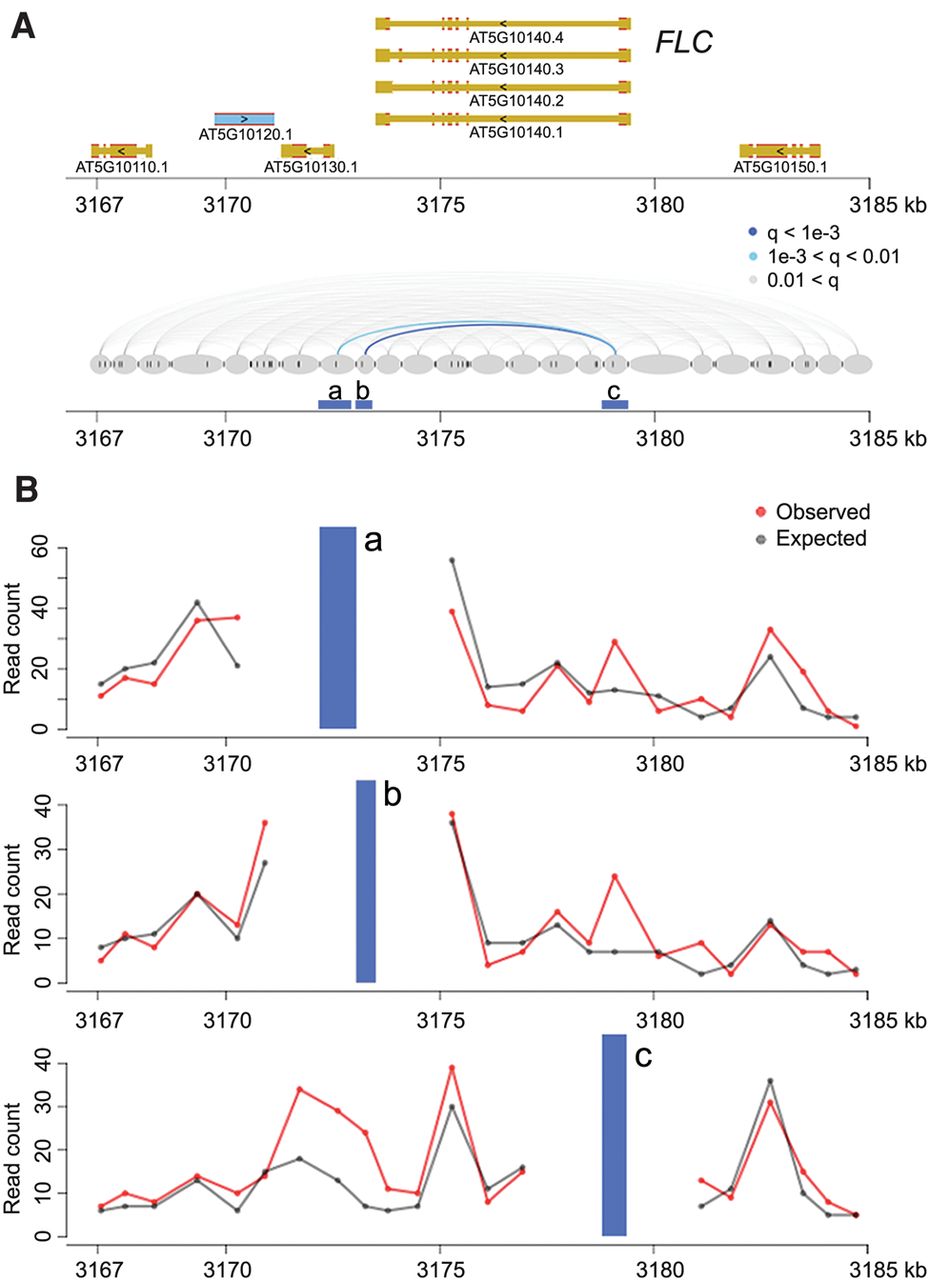
Figure 1.
Chromatin loops at FLC. (A) The FLC locus including 5 kb up- and downstream was divided into segments (gray ovals) based on the location of restriction sites (dark gray vertical ticks between and inside ovals). Chromatin interactions (with distances over 2 kb) within this region are shown in the bottom diagram as lines connecting the corresponding segments and colored according to the q-values. Segments a, b, and c are analyzed in detail in B. (B) Observed and expected read counts with three segments. The blue vertical bars correspond to the anchor regions highlighted in A.


