
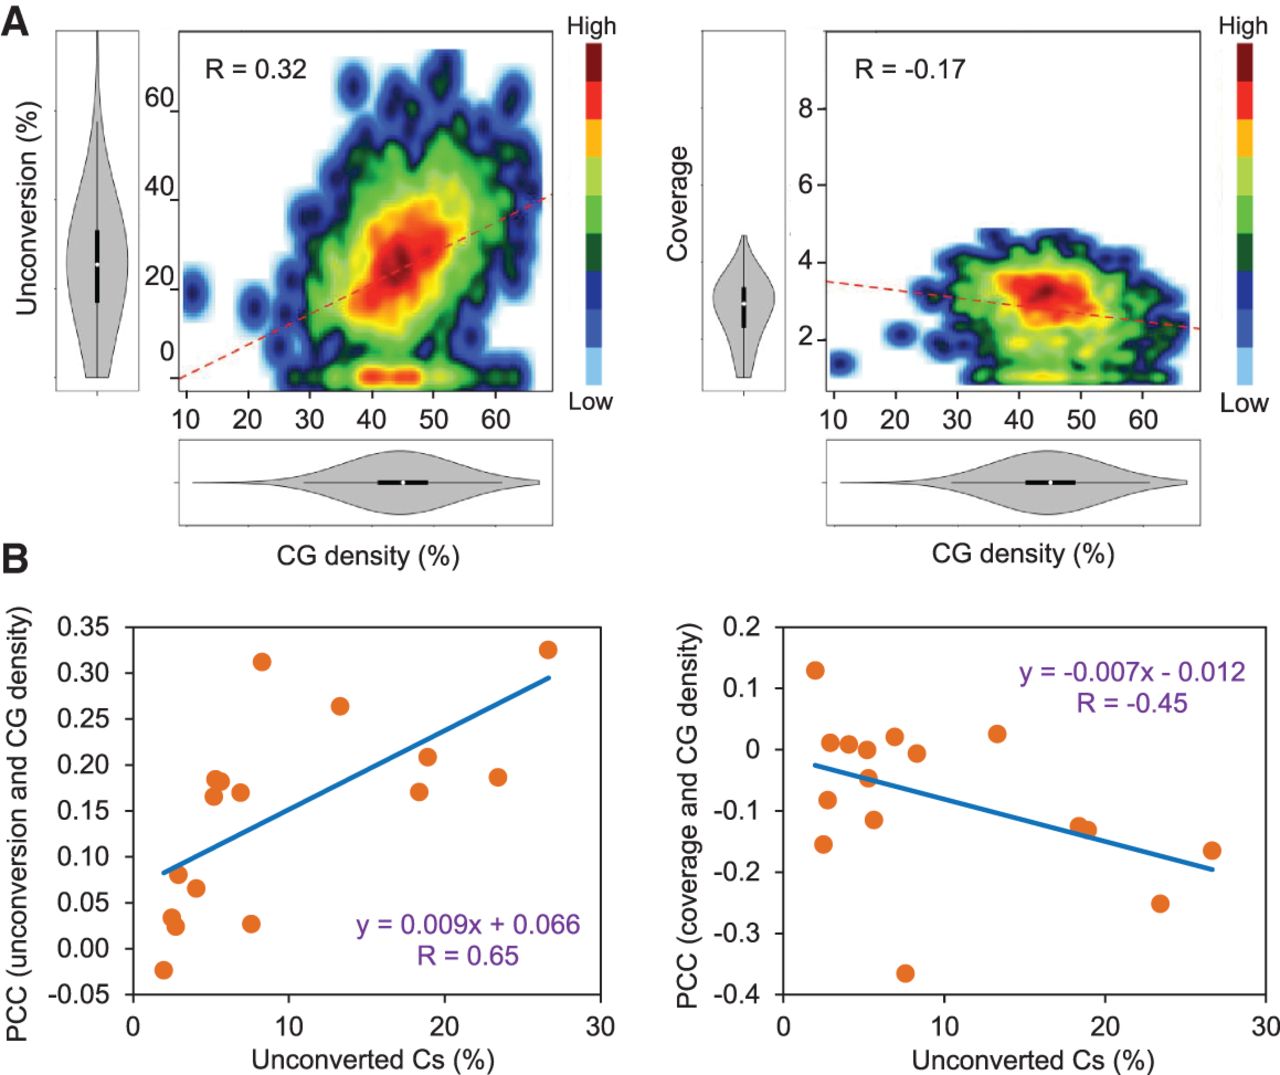
High CG density challenges cytosine conversion and coverage of mitochondrial DNA. Data from different genome-wide bisulfite sequencing experiments were analyzed. (A) Density plot representations of cytosine unconversion or coverage versus the percentage of CG residues within 100-bp tiles (CG density). All the mitochondrial cytosines from experiment SRR492932 (Dowen et al. 2012) were grouped in 100-bp tiles and analyzed. The distributions of unconversion, coverage, and CG densities are represented in both axes. Pearson correlation coefficients (R) are also indicated. (B) Scatter plot representations of Pearson correlation coefficients between cytosine unconversion or coverage and CG density per 100-bp tiles (PCC values) versus the mean mitochondrial methylation estimated in every experiment (percentage of unconverted Cs). P-values for cytosine unconversion and coverage are 0.0064 and 0.0802, respectively.


