
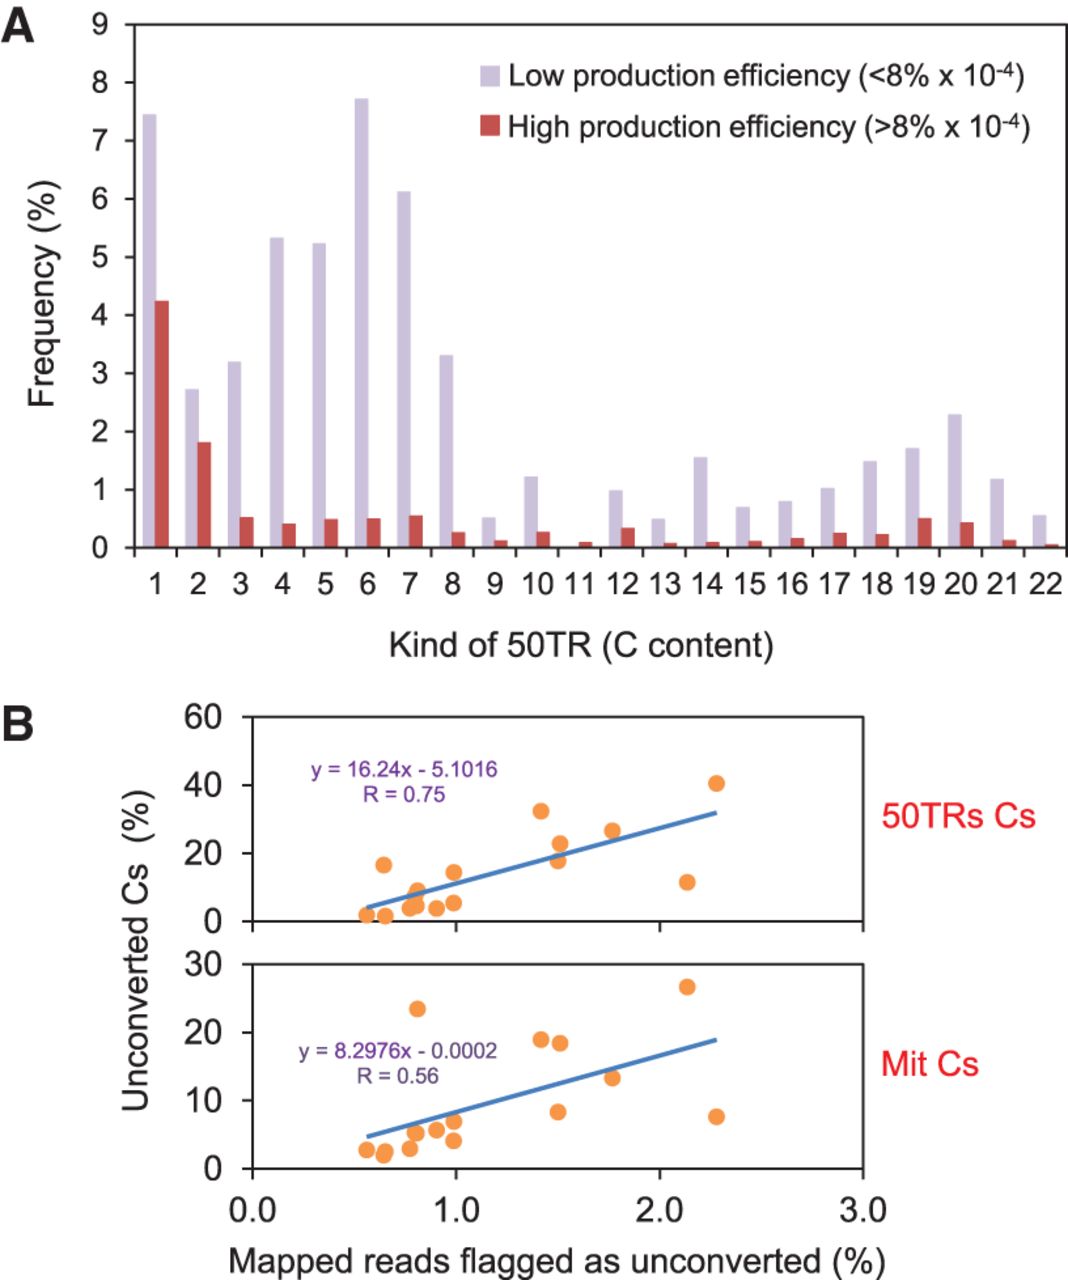
Low levels of converted reads underlie the overestimation of cytosine methylation. (A) Bar plot representation showing the distribution of cytosines within 50TRs. The percentages of wild-type 50TRs containing different numbers of cytosines are represented. Low ( < 8% × 10−4) and high ( > 8% × 10−4) telomeric C-rich strand production efficiency experiments were grouped and their average percentages were independently represented. (B) Scatter plot representation of the percentage of unconverted cytosines detected within 50TRs or mitochondrial reads versus the percentage of mapped reads flagged as potentially unconverted. Potential unconverted reads were flagged by BS-Seeker2 as follows: #(mCH sites) > 5 and [#(mCH sites)/#(all CH sites)] > 0.5. P-values for 50TRs and mitochondrial reads are 0.0008 and 0.0241, respectively.


