
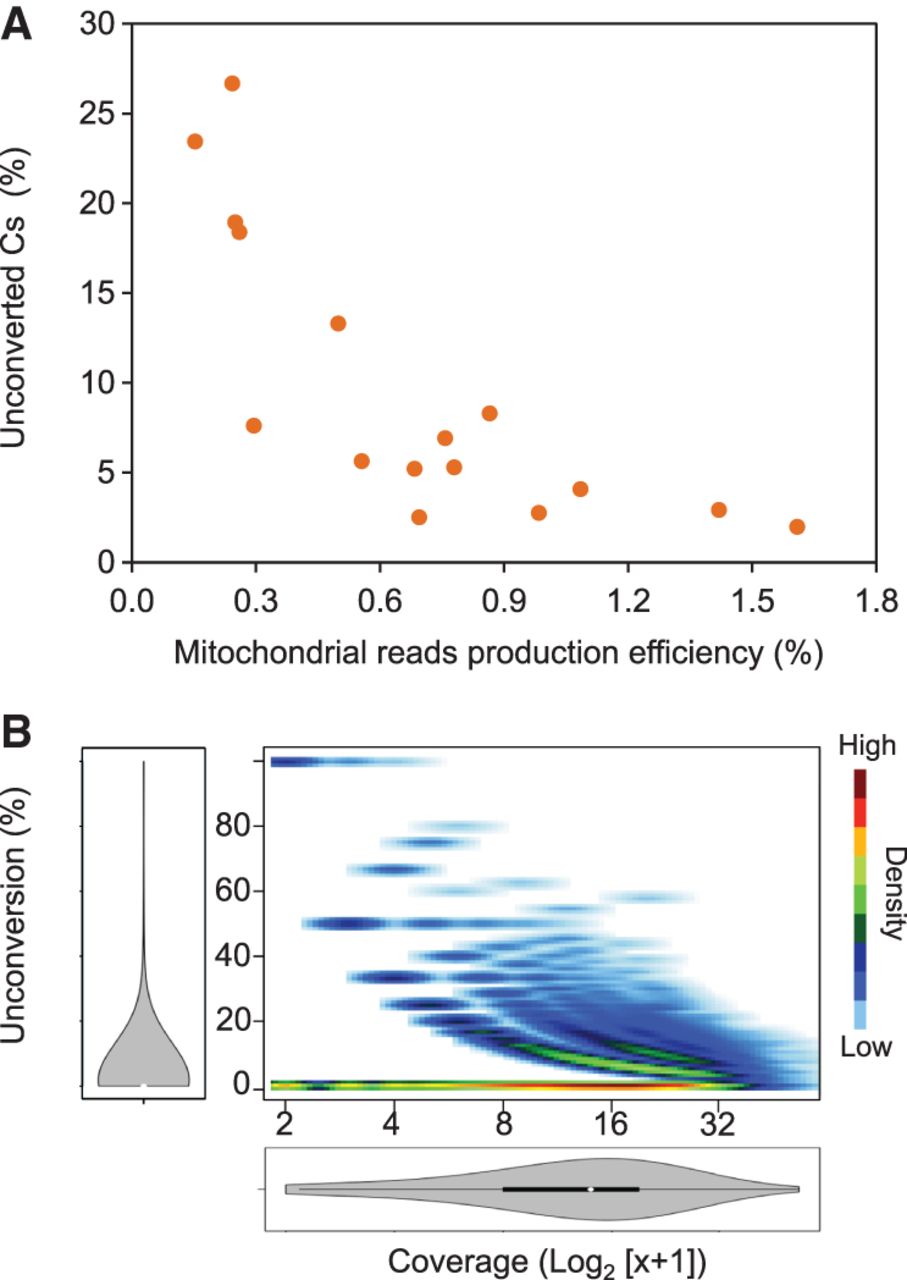
Mitochondrial DNA methylation estimates vary with the mitochondrial reads' production efficiency. Data from different genome-wide bisulfite sequencing experiments were analyzed. (A) Scatter plot representation of the percentage of unconverted cytosines (Cs) within mitochondrial reads versus the mitochondrial read production efficiency in wild-type plants. The production efficiencies were calculated as the number of mitochondrial reads divided by the total number of mapped reads. They are expressed as percentages. (B) Density plot representation of unconversion versus coverage for all the mitochondrial cytosines analyzed in experiment SRR578938 (Zemach et al. 2013). The distribution of unconversion and coverage is represented in both axes.


