
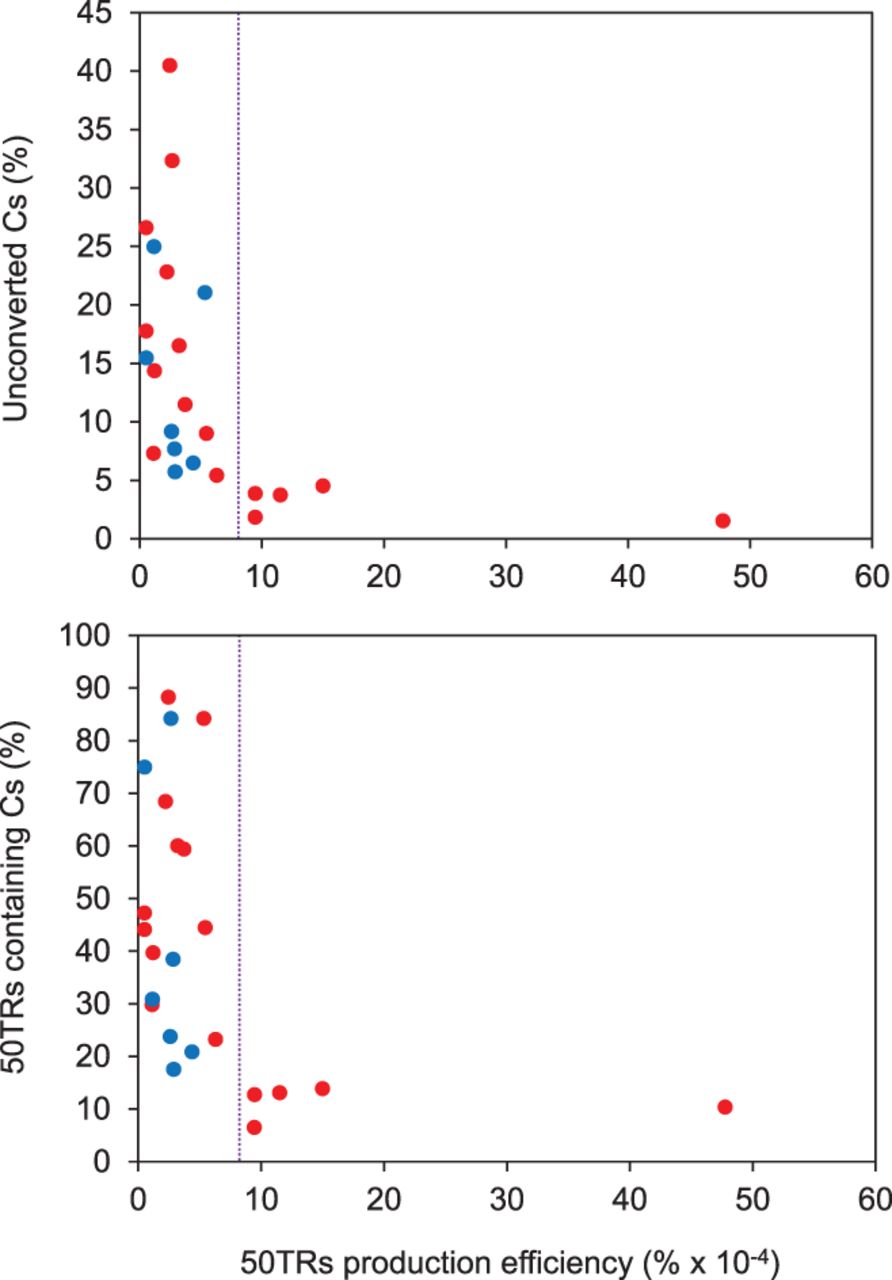
Telomeric DNA methylation estimates vary with the telomeric reads' production efficiency. Data from different genome-wide bisulfite sequencing experiments were analyzed. The upper panel shows the scatter plot representation of the percentage of unconverted cytosines (Cs) detected within 50TRs (estimated methylation levels) versus the telomeric C-rich strand production efficiency. Production efficiencies were calculated as the number of 50TRs divided by the total number of mapped reads and expressed as percentages. The lower panel shows the scatter plot representation of the percentage of 50TRs containing cytosines versus the telomeric C-rich strand production efficiency. Data obtained from wild-type experiments are represented as red circles and data obtained from DNA methylation mutants are represented as blue circles. These mutants include single (met1-3, cmt2, ddm1-2, drd1-7), double (met1-3 and cmt3-11, ddm1-2 and drd1-7), and triple (drm1-2, drm2-2 and cmt3-11) mutants.


