
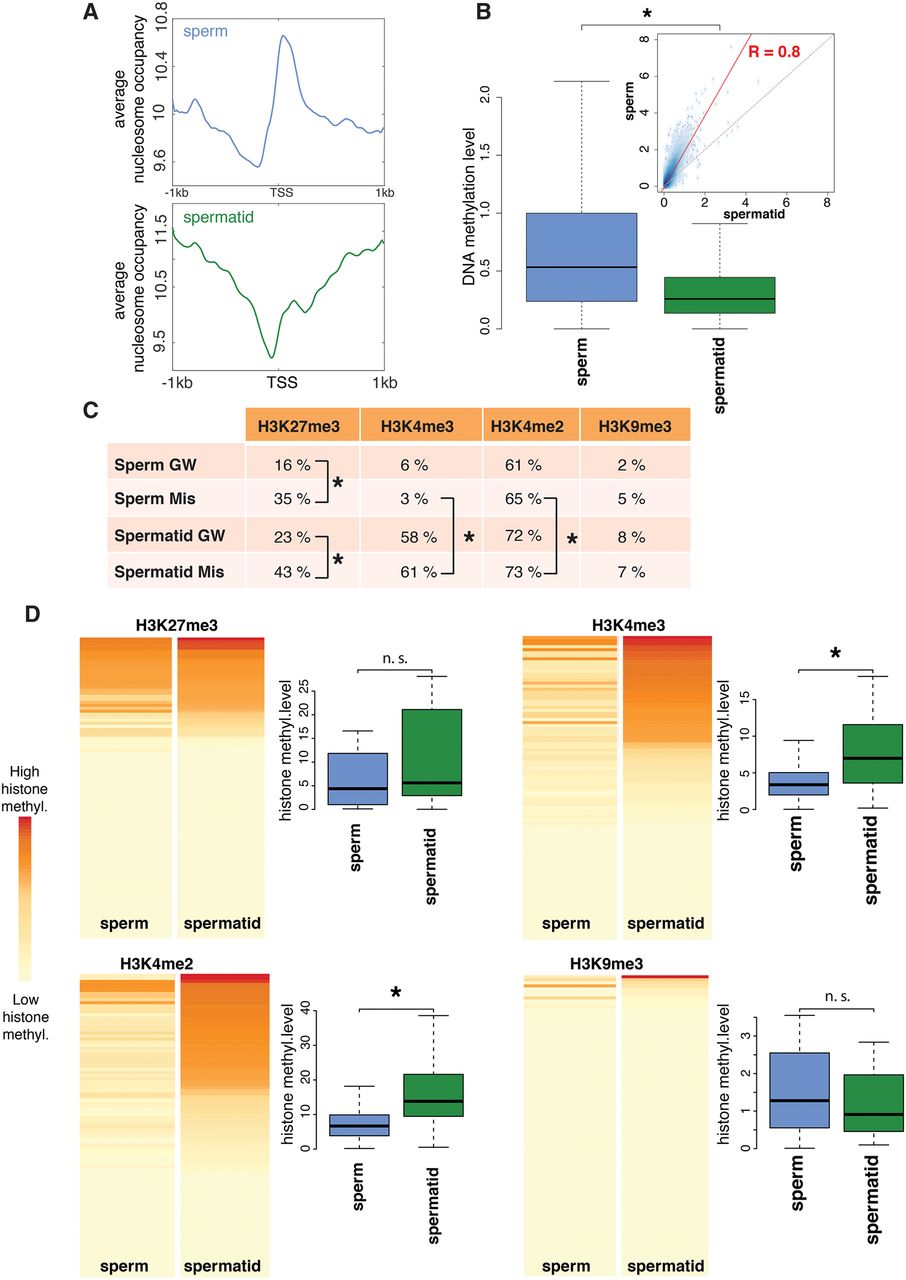
Genes that are misregulated in spermatid-derived embryos have different epigenetic features in sperm and spermatid. (A) Genome-wide average nucleosome occupancy at the TSS of sperm (blue) and spermatid (green) genes. (B) Boxplots showing genome-wide DNA methylation levels at the TSS ± 1 kb of sperm (blue) and spermatid (green) genes. Inset shows correlation between the DNA methylation levels of sperm and spermatid (R = 0.8, P-value < 0.05); red line: regression; dotted line: diagonal. (C) Percentage of genes harboring H3K27me3, H3K4me3, H3K4me2, or H3K9me3 peaks genome-wide (GW) and at misregulated genes (Mis). (*) P-value < 0.05 (χ2 test). (D) Heat maps representing H3K27me3, H3K4me3, H3K4me2, and H3K9me3 overall levels (see Supplemental Material and Supplemental Fig. S8) at misregulated genes in sperm (first column) and spermatid (second column). Each map is sorted according to the signal in spermatid. Boxplots show the distribution of methylation levels across misregulated genes. (*) P-value < 0.05 (KS-test) (Supplemental Table S7).


