
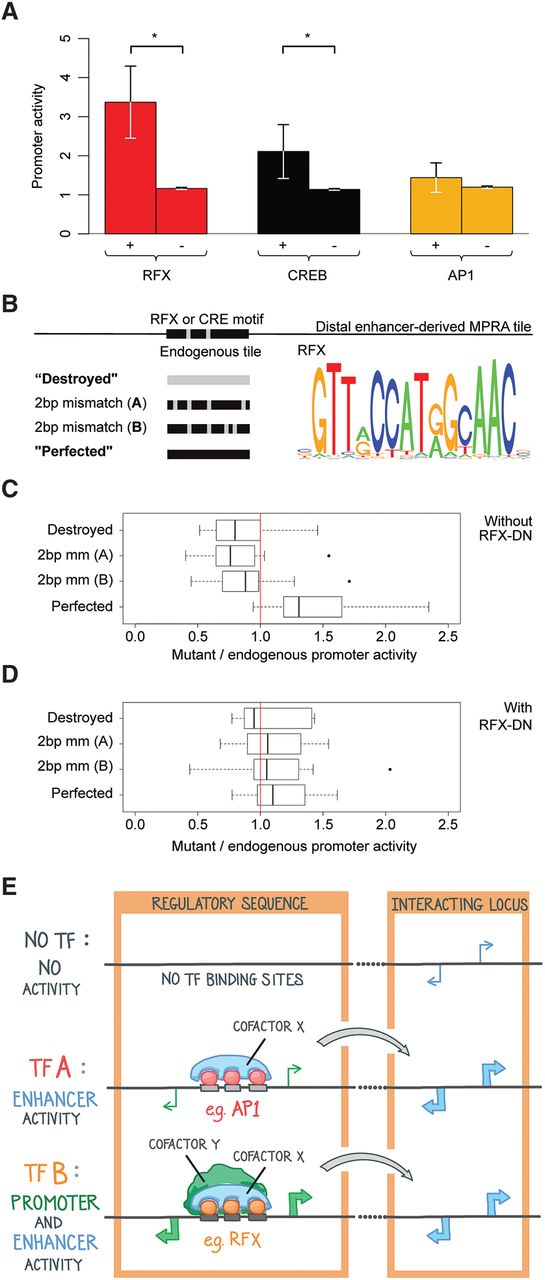
The promoter activity of distal enhancers requires RFX motifs. (A) Mean promoter activity of distal enhancer tiles that have zero (“−”) or at least two (“+”) occurrences of RFX, CREB, and AP1 motifs: (*) P < 0.05 by Student's t-test. Promoter activity is defined and normalized as in Figure 2B, and each tile's mean promoter activity from two biological replicates is averaged across all “+” and “−” tiles. The apparent lack of error bars in “−” tiles is due to the mean and SEM being computed across a large number of tiles, because most tiles lack these motifs. (B) Mutations of RFX motif occurrences within distal enhancer sequences. Each motif occurrence was altered in four different ways. A gray portion indicates a nucleotide that does not match the corresponding motif represented at right. Motifs are from HT SELEX position frequency matrices for RFX5 (Jolma et al. 2013). (C) Ratios of mutant to control promoter activity using MPRAs, with median and 25th–75th percentiles shown as bars and boxes. A ratio of one (no change in promoter activity) is indicated with a vertical red line. Promoter activity is defined as in Figure 2B. The 20 control tiles include 11 distal enhancer tiles, shown separately in Supplemental Figure S5F. (D) Same as C but for RFX dominant negative-transduced neurons. (E) Model: Transcriptional activators and coactivators determine the relative extent of enhancer and promoter activities.


