
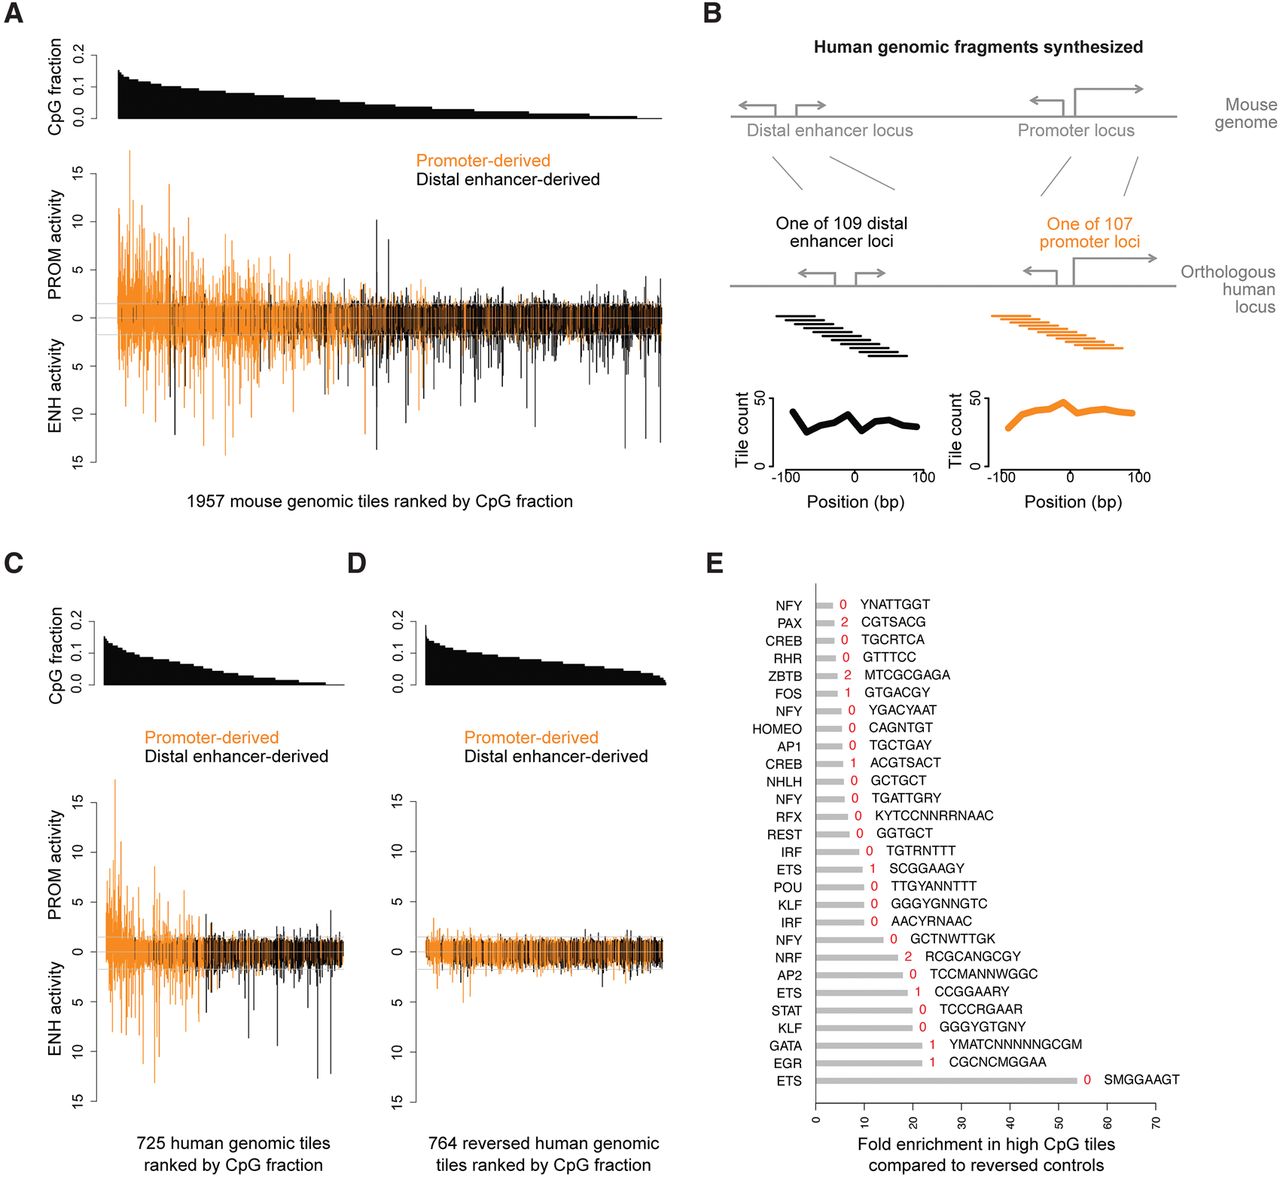
Promoter activity more than enhancer activity is associated with CpG content. (A) The enhancer and promoter activities of mouse genomic DNA tiles ranked by the CpG dinucleotide frequency in each tile. (B) We tiled human promoter and distal enhancer loci that are orthologous to selected mouse loci. (C) The enhancer and promoter activities of 725 human genomic tiles ranked by CpG frequency. (D) The enhancer and promoter activities of 764 reversed human genomic control tiles ranked by CpG frequency. (E) The 28 most-enriched TF motifs in tiles with a CpG fraction >0.087, compared to reversed controls. The highest-scoring matches in the JASPAR database were chosen as the TF motif names, and six additional motifs without clear TF matches are in Supplemental Table S2. The number of CpG dinucleotides in each motif is indicated in red. In A, C, and D, each value is a mean from n = 2 biological replicates. Promoter and enhancer activities are defined as in Figure 2B.


