
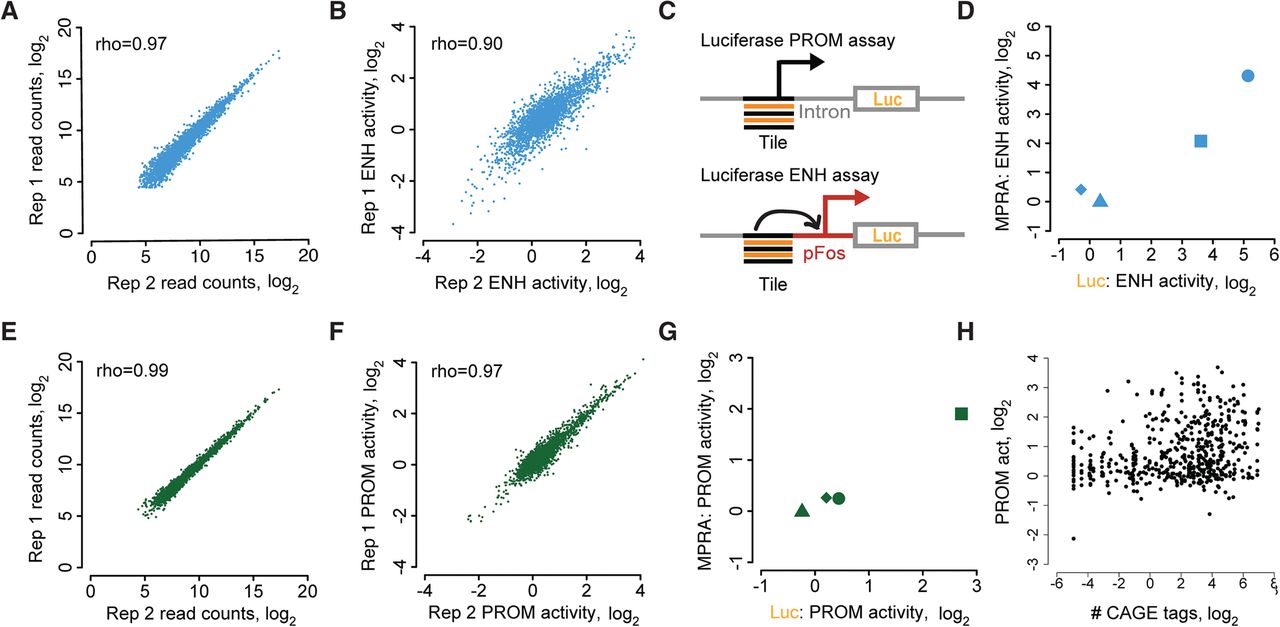
Replicability of enhancer and promoter activities from MPRAs. (A) Replicability of read counts across two biological replicates of an enhancer activity MPRA. (B) Replicability of enhancer activity from A. MPRA activity is defined in this and all subsequent figures as the cDNA to DNA ratio, normalized to the corresponding ratio for negative control sequences, which are included in each MPRA library. (C) Schematic of luciferase assay design. Enhancer activity was assessed with test sequences upstream of a minimal FOS promoter. Promoter activity was tested as in Figure 1C with a luciferase coding sequence in place of GFP. (D) Comparison of MPRA-based and luciferase-based enhancer activity measurements, with each shape representing a specific test sequence. Test sequences are artificial, with repeats of RFX (square), AP1 (circle), MYBL2 (triangle), and NFYshort (diamond) motifs with spacers TTATTTTAAGA (RFX, MYBL2) and CCCGCGCTGCC (AP1, NFYshort). (E–G) Same as A,B,D but for promoter activity. (H) Correlation of MPRA-based promoter activity with CAGE tag counts. Pearson's R = 0.27, P < 10−16 from t-statistic. Throughout this work, except where noted, enhancer and promoter activities are reported as the maximal activity of the unstimulated and KCl-depolarized conditions. In A, B, E, and F, the unstimulated condition is shown.


