
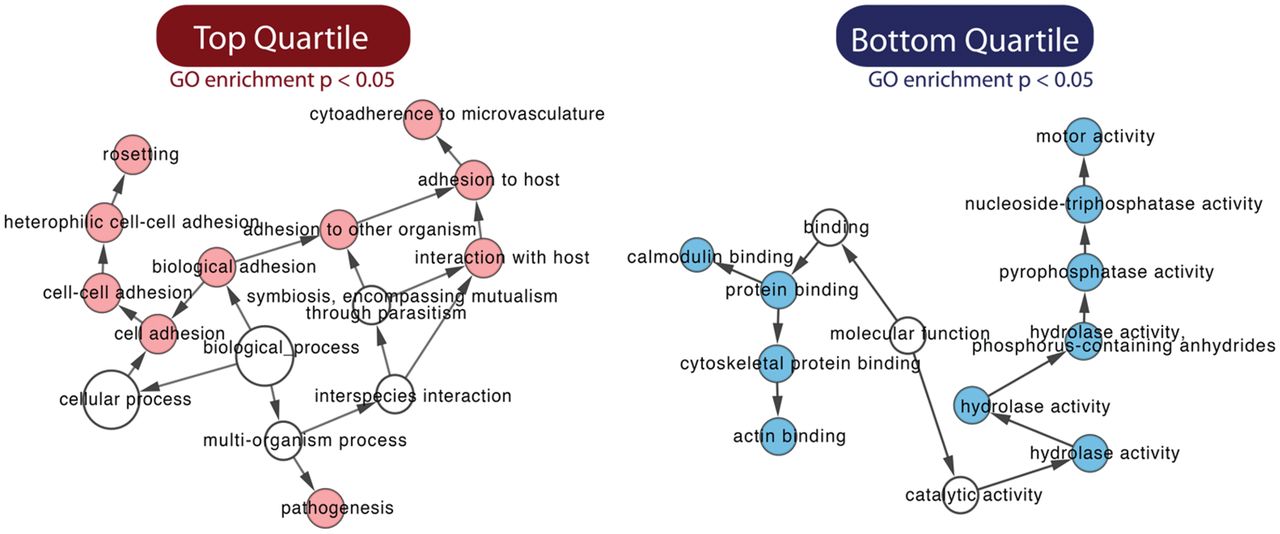
Figure 6.
Mutant-associated functions in competitive growth assay for the top and bottom quartiles. The gene enrichment is performed with GO term representation by a hypergeometric test; P-value adjusted with the Benjamini-Hochberg method. The solid circle sizes represent the number of mutants in the group.


