
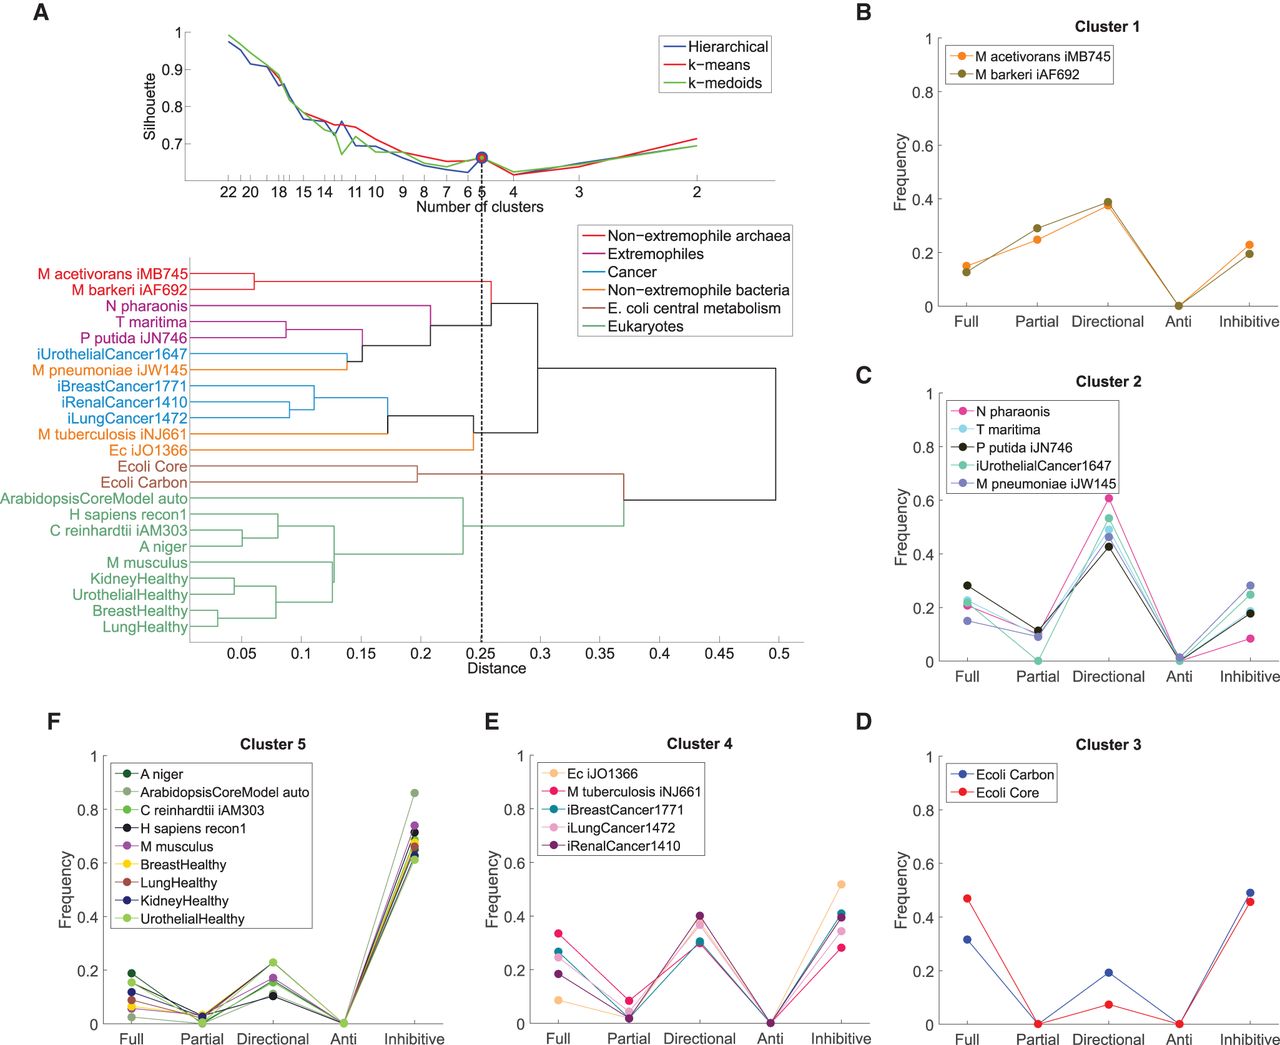
Clustering of flux coupling profiles. (A, top) Silhouette index over number of clusters for three clustering methods: hierarchical, k-means, and k-medoids. For five clusters (dashed line), the three methods give identical clustering (blue, red, and green circles), which is shown in B–F. (Bottom) Cluster dendrogram obtained from hierarchical clustering of the flux coupling profiles using Euclidean distances (see also Supplemental Fig. S3). (B) Cluster 1 contains the flux coupling profiles of both nonextremophile archaea. (C) Cluster 2 combines the flux coupling profiles of organisms adapted to extreme environmental conditions: the haloalkaliphilic Natronomonas pharaonis, the hyperthermophilic T. maritima, the solvent tolerant Pseudomonas putida, as well as the pathogen M. pneumoniae and urothelial cancer. (D) Cluster 3 contains the flux coupling profiles of both networks representing E. coli central metabolism. (E) Cluster 4 combines the genome-scale networks of E. coli, M. tuberculosis, and three of the four cancer networks. (F) Cluster 5 contains all analyzed eukaryotic networks, including the fungi Aspergillus niger, unicellular algae Chlamydomonas reinhardtii, Homo sapiens, Mus musculus, and the four tissue-specific human networks.


