
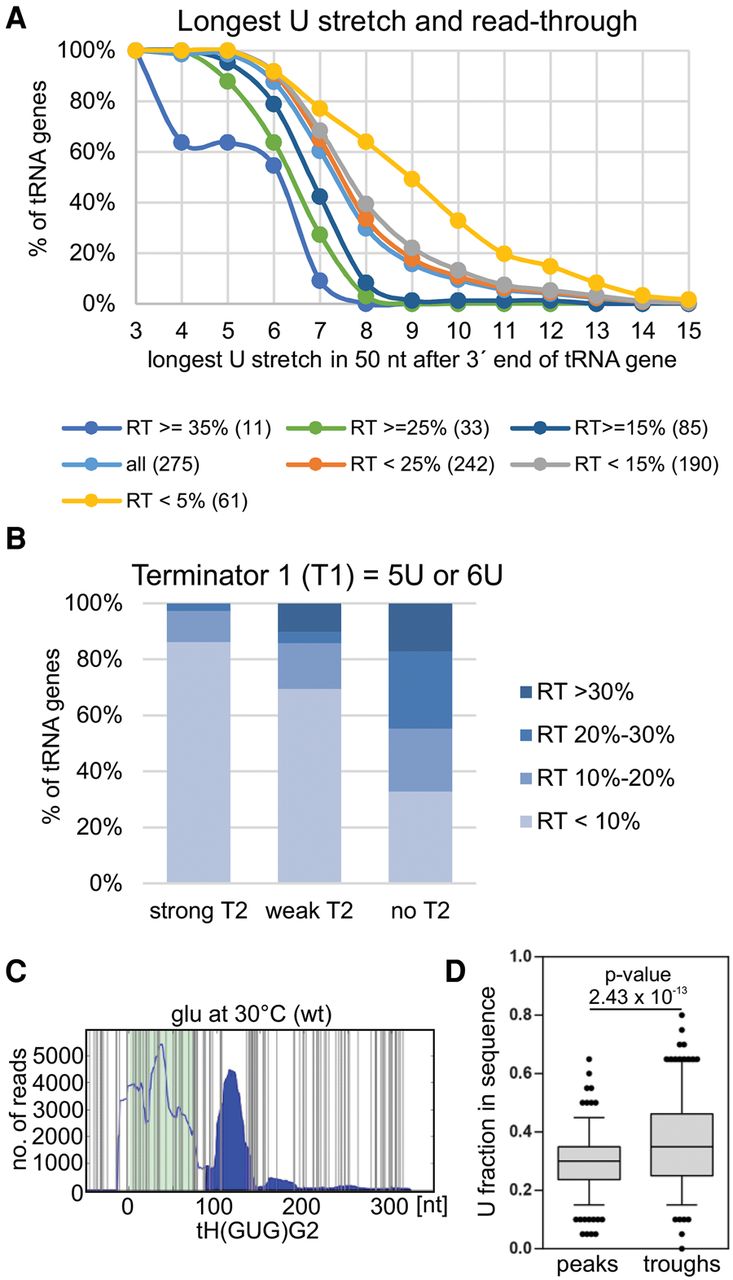
Canonical and noncanonical RNAPIII termination signals. (A) Read-though (RT) level depends on the strength of the canonical termination signal. Cumulative plot showing distribution of the longest U stretch within 50 nt downstream from the tRNA 3′-end. All tRNA genes were divided according to RT level (<5%, <15%, <25%, >15%, >25%, and >35%). Numbers of genes are presented in parentheses. (B) A weak first (canonical) terminator (T1) is often supported by a second terminator (T2). Analysis of secondary termination signal in a 40-nt range from first termination signal for weak terminators T1 = 5U and T1 = 6U. The second terminator is classified as strong (more than 6U), weak (less than 6U), or absent (no clear T2). (C) Uracil abundance is a noncanonical termination signal within read-through regions. Hit distributions along tH(GUG)G2 with all U nucleotides marked (vertical gray lines) revealed a correlation between U frequency and RNAPIII transcription/termination. Green background indicates the exon position(s). Filled area indicates RNAPIII read-through. (D) Boxplot and line plot showing the distribution of uracil abundance in peaks and following troughs within RT. The first, canonical termination sites were excluded from this analysis. P-value = 2.43 × 10⁻¹³ was calculated using Wilcoxon test for peaks with average reads above 300 and considering a 20-nt region comprising 10 nt before and 10 nt after each peak/trough.


