
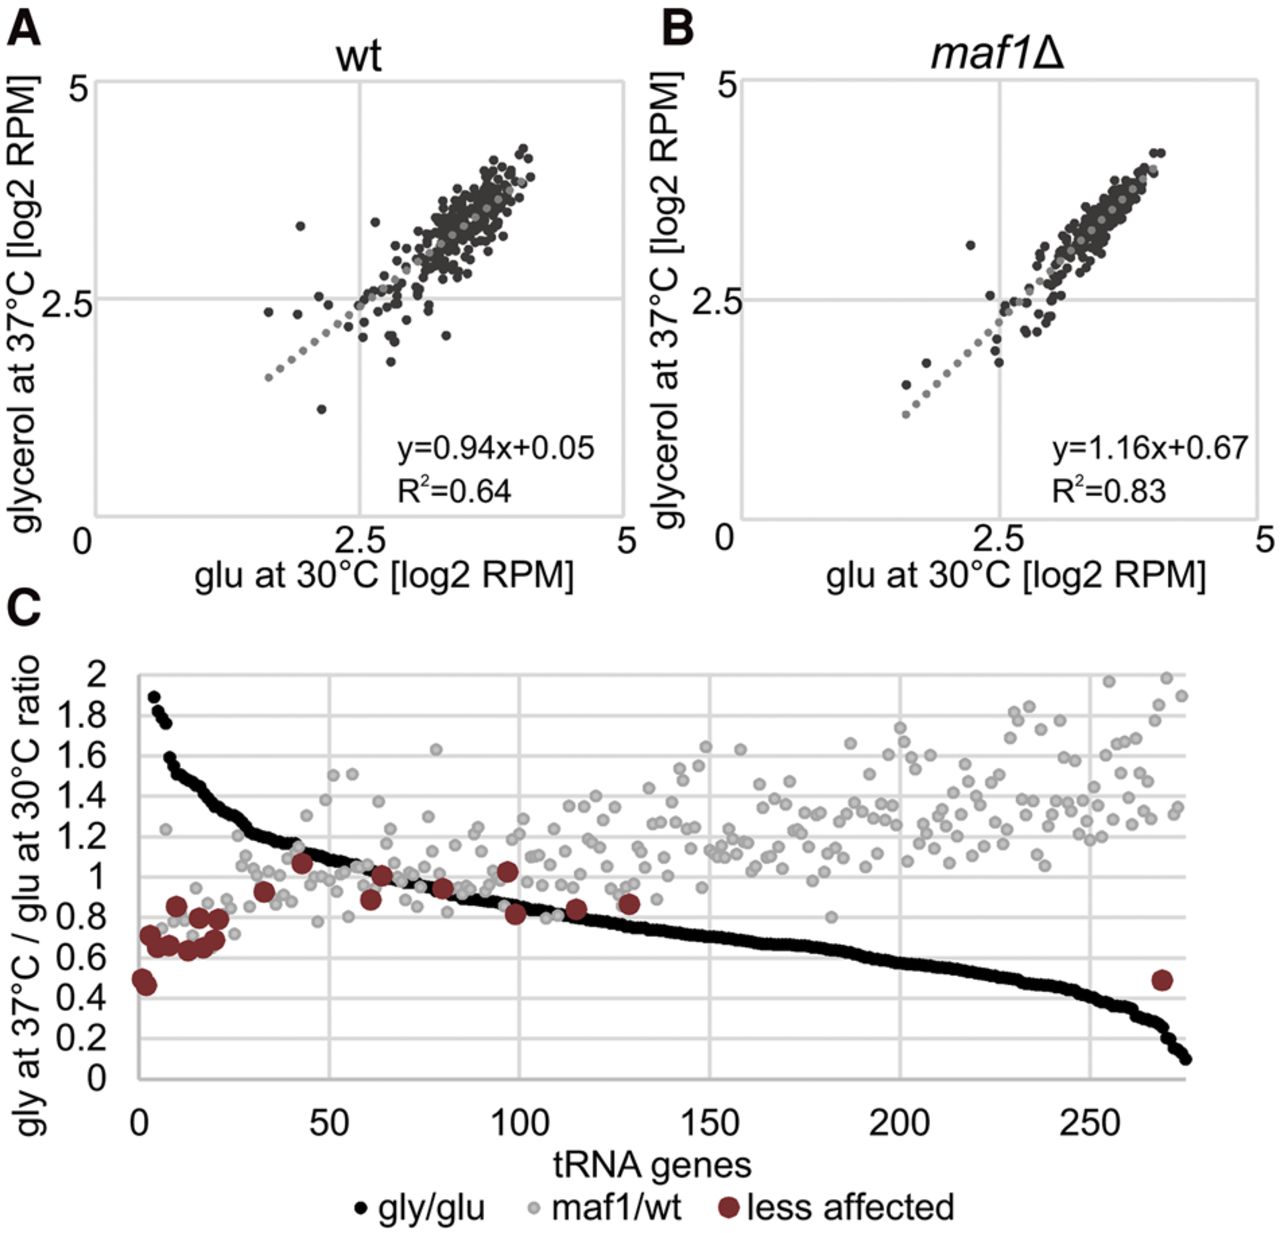
Comparison of genome-wide tRNA genes transcription under different growth conditions. (A) Correlation of relative expression of nuclear tRNA genes between permissive and repressive conditions for wt strain. The correlation coefficient (R2) reflects how well the data fit the trend line. Two outlying bottom points are not shown. (B) Correlation of relative expression of nuclear tRNA genes between permissive (glucose at 30°C) and repressive conditions (glycerol at 37°C) for maf1Δ strain. Two outlying bottom points are not shown. (C) Ratios of relative expression level of all nuclear tRNA genes under stress conditions. A subset of tRNA genes is less responsive to regulation by Maf1. Genes are ordered according to the Gly:Glu expression ratio (the highest value for tD(GUC)N = 14.78 is not shown). In the same order, the maf1Δ:wt ratio is plotted. The least affected tRNA for each amino acid is colored in dark red.


