
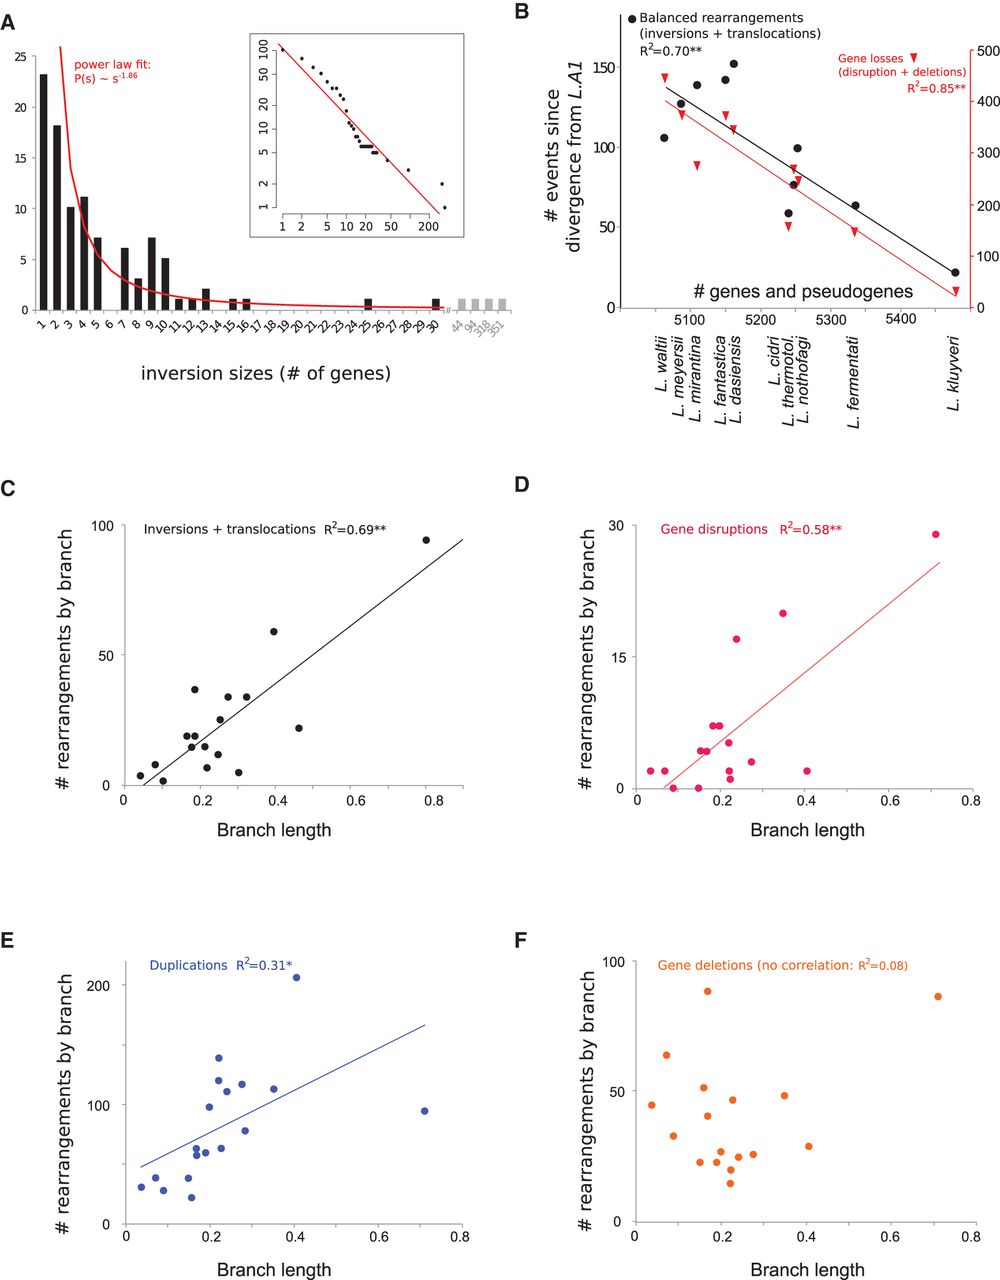
(A) Distribution of inversion sizes (in number of genes) accumulated since the divergence from the last common ancestor of the
genus (L.A1). The red line symbolizes a power law fit to the data ( , with C = 106.4 and α = 1.86), which represents the probability of an inversion having its two end-points at s genes apart. The inset plot shows a cumulative histogram of the same data plotted with logarithmic scale. (B) Correlations between the number of genes and pseudogenes in extant genomes and number of balanced rearrangements, i.e.,
inversions and translocations (left y-axis) and with the numbers of gene losses, i.e., gene disruptions and deletions (right y-axis). (**) P < 10−4. No correlation was found between the number of genes in extant genomes and the number of gene duplications (data not shown).
(C) Correlation between the number of balanced rearrangements (inversions and translocations) and the corresponding individual
branch lengths from the Lachancea species tree based on the concatenation of 3598 orthologous genes corresponding to 1,983,702 aligned positions (Supplemental Fig. S4). (**) P < 10−4. (D) Correlation between the number of gene disruptions resulting from balanced rearrangements and branch lengths estimated as
in C. (**) P < 10−4. (E) Correlation between the number of gene duplications and branch lengths estimated as in C. (*) P < 0.05. (F) No significant correlation between the number of gene deletions and branch lengths estimated as in C.
, with C = 106.4 and α = 1.86), which represents the probability of an inversion having its two end-points at s genes apart. The inset plot shows a cumulative histogram of the same data plotted with logarithmic scale. (B) Correlations between the number of genes and pseudogenes in extant genomes and number of balanced rearrangements, i.e.,
inversions and translocations (left y-axis) and with the numbers of gene losses, i.e., gene disruptions and deletions (right y-axis). (**) P < 10−4. No correlation was found between the number of genes in extant genomes and the number of gene duplications (data not shown).
(C) Correlation between the number of balanced rearrangements (inversions and translocations) and the corresponding individual
branch lengths from the Lachancea species tree based on the concatenation of 3598 orthologous genes corresponding to 1,983,702 aligned positions (Supplemental Fig. S4). (**) P < 10−4. (D) Correlation between the number of gene disruptions resulting from balanced rearrangements and branch lengths estimated as
in C. (**) P < 10−4. (E) Correlation between the number of gene duplications and branch lengths estimated as in C. (*) P < 0.05. (F) No significant correlation between the number of gene deletions and branch lengths estimated as in C.


