
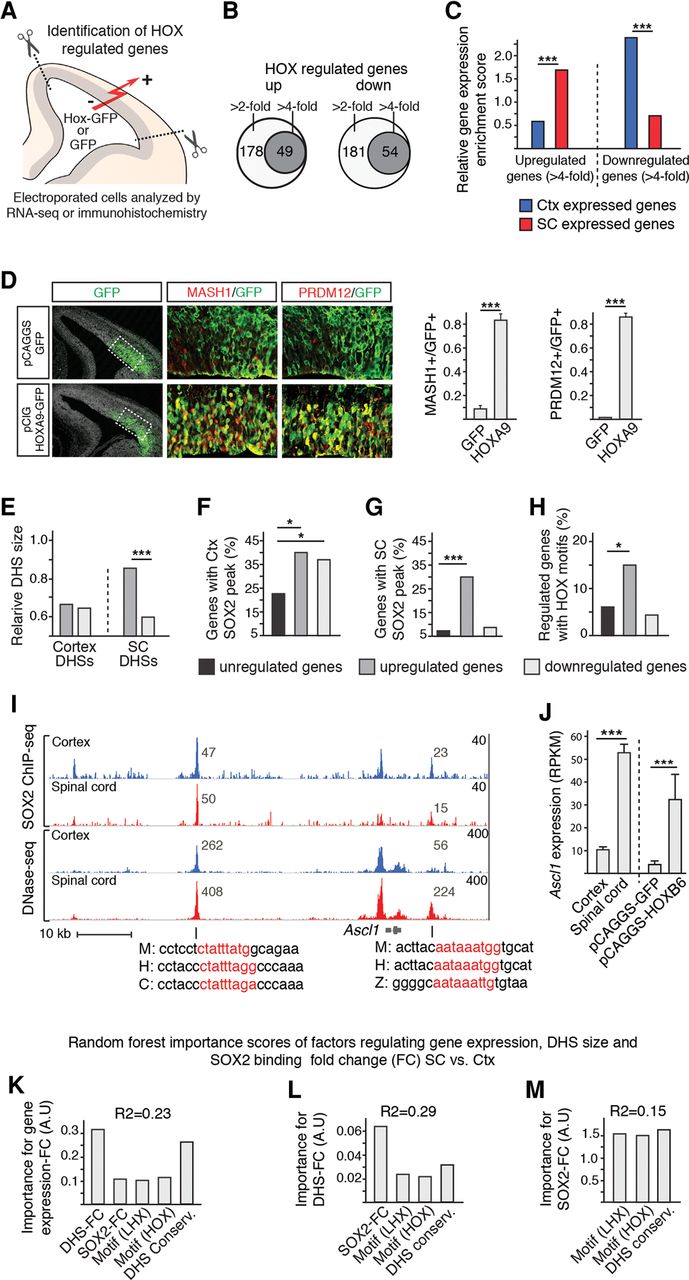
Prediction of gene expression specificity in cortical and spinal cord NSCs. (A) Overview of experimental design for identification of HOX regulated genes in E13.5 mouse cortex. (B) Venn diagrams showing the number of genes up- and down-regulated more than two- and fourfold in cortical NSCs after Hoxb6 electroporation. (C) Bar graph showing, as relative gene expression enrichment scores, that spinal cord genes are predominantly up-regulated and that cortex genes are predominantly down-regulated in cortical NSCs upon Hoxb6 electroporation. (D) Immunohistochemical analysis of Hoxa9-electroporated cortices demonstrates a broad up-regulation of MASH1 and PRDM12, which are normally expressed predominantly in the spinal cord. (E) Relative size, as defined as number of sequence reads, of cortical and spinal cord DHSs associated with genes up- and down-regulated more than fourfold. (F,G) Enrichment of cortex (F) and spinal cord (G) SOX2 peaks around genes up- and down-regulated more than fourfold by HOXB6 misexpression. Genes that change <1.1-fold are defined as unregulated. (H) Percentage of genes, up- and down-regulated more than fourfold, associated with accessible chromatin in the cortex and containing HOX motifs. (I) Tracks around the ectopically up-regulated Ascl1 gene. Tracks show overlapping SOX2 peaks and DHSs containing conserved HOX motifs (red letters in mouse [M], human [H], chicken [C], and zebrafish [Z] sequences) in the cortex (blue tracks) and spinal cord (red tracks). Note size differences (read values inset) of DHSs in the cortex and spinal cord. (J) Bar graph shows RPKM values of Ascl1 in cortical and spinal cord NSCs under normal conditions and in cortical NSCs after GFP or Hoxb6 electroporation. (K–M) Random forest importance scores of regulatory features controlling gene expression fold change (FC) (K), DHS-FC (L), and SOX2-FC (M) in spinal cord versus cortical NSCs. (*) 0.05 > P > 0.01; (***) P < 0.001.


