
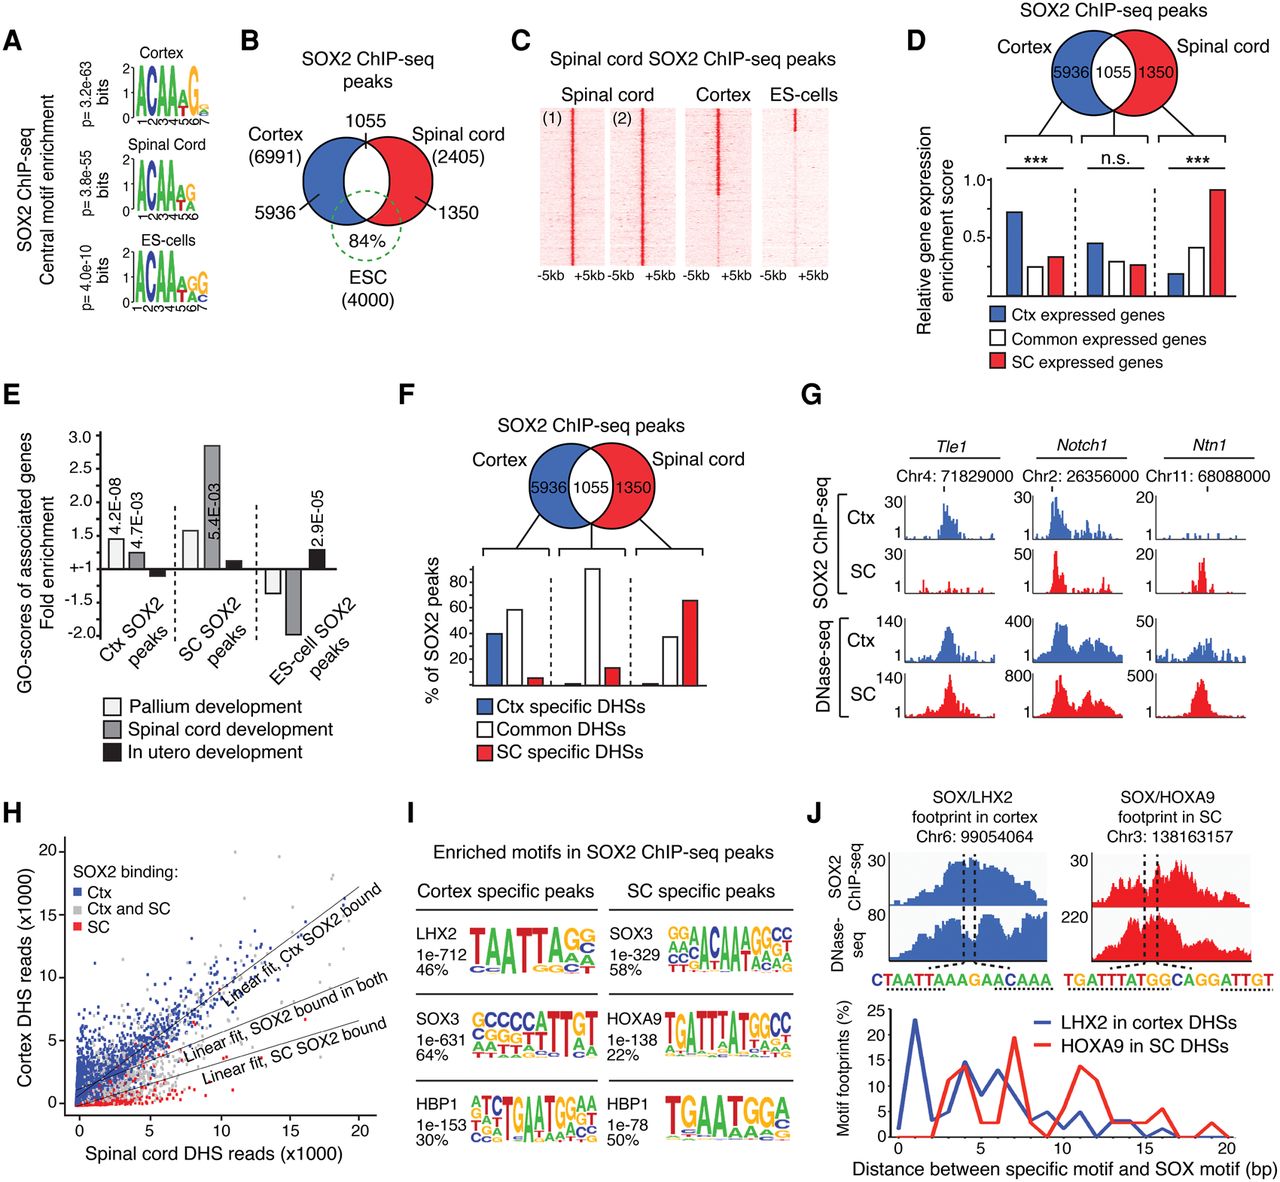
Differential SOX2 binding pattern in cortical and spinal cord NSCs. (A) Centrally enriched SOX motifs in ChIP-seq peaks. P-values of best matching motifs are shown. (B) Venn diagram showing overlap in SOX2 target site selection in the cortex (blue), spinal cord (red), and ES cells (green). (C) Heatmaps of reads from replicate spinal cord SOX2 ChIP-seqs and merged SOX2 ChIP-seqs in the cortex and ES cells. (D) Venn diagram and bar graph comparing the enrichment of expression profiles from the cortex (blue bar), spinal cord (red bar), or in both these tissues (white bar) with genes associated with cell-type–specific (blue and red circle) or common SOX2 ChIP-seq peaks (white region). (E) Specific term GO enrichment scores for genes associated with cortex (Ctx)-specific SOX2 peaks, spinal cord (SC)–specific SOX2 peaks, and ES cell–specific SOX2 peaks. Light gray bars represent “Pallium development,” medium gray bars represent “Spinal cord development,” and black bars represent “In utero development.” (F) Venn diagram and bar graph showing the distribution of cortical (blue circle), spinal cord (red circle), or common (white region) SOX2 ChIP-seq peaks within regions of specific (blue and red bars) and common DHSs (white bar). (G) Read density tracks show representative examples of cell-type–specific and common SOX2 peaks and their distribution within common DHSs, found both in cortical (blue) and spinal cord (red) NSCs. (H) Scatter plot showing the number of sequence reads defining shared DHSs in the cortex and spinal cord in relation to the cellular distribution of SOX2 peaks. DHSs bound by SOX2 in cortical NSCs are shown in blue (Ctx), in spinal cord NSCs in red (SC), and in both these cell types in gray. The specific relationship between SOX2 binding and chromatin accessibility is reflected by angle differences of the group-specific regression lines compared to the regression line for all data points. The P-values are <2.2 × 10⁻¹⁶ for both the regression lines defining SOX2-bound DHSs in the cortex and the spinal cord, assuming a null hypothesis in which all points come from the same distribution. (I) Enrichment of transcription factor binding motifs in DNA regions specifically bound by SOX2 in the cortex or spinal cord. (J) Example genomic regions identified with neighboring SOX2 and LHX2 (cortex SOX2 ChIP-seq and DNase-seq data shown in blue), or SOX2 and HOXA9 (spinal cord SOX2 ChIP-seq and DNase-seq data shown in red), motif containing DNase-seq footprints. Dashed lines indicate SOX, LHX2, and HOXA9 motifs. Percentage of all neighboring footprinted motifs found with specific base pair (bp) spacing between SOX2 and LHX2 (blue; in cortex), or HOXA9 (red; in spinal cord). (***) P < 0.001.


