
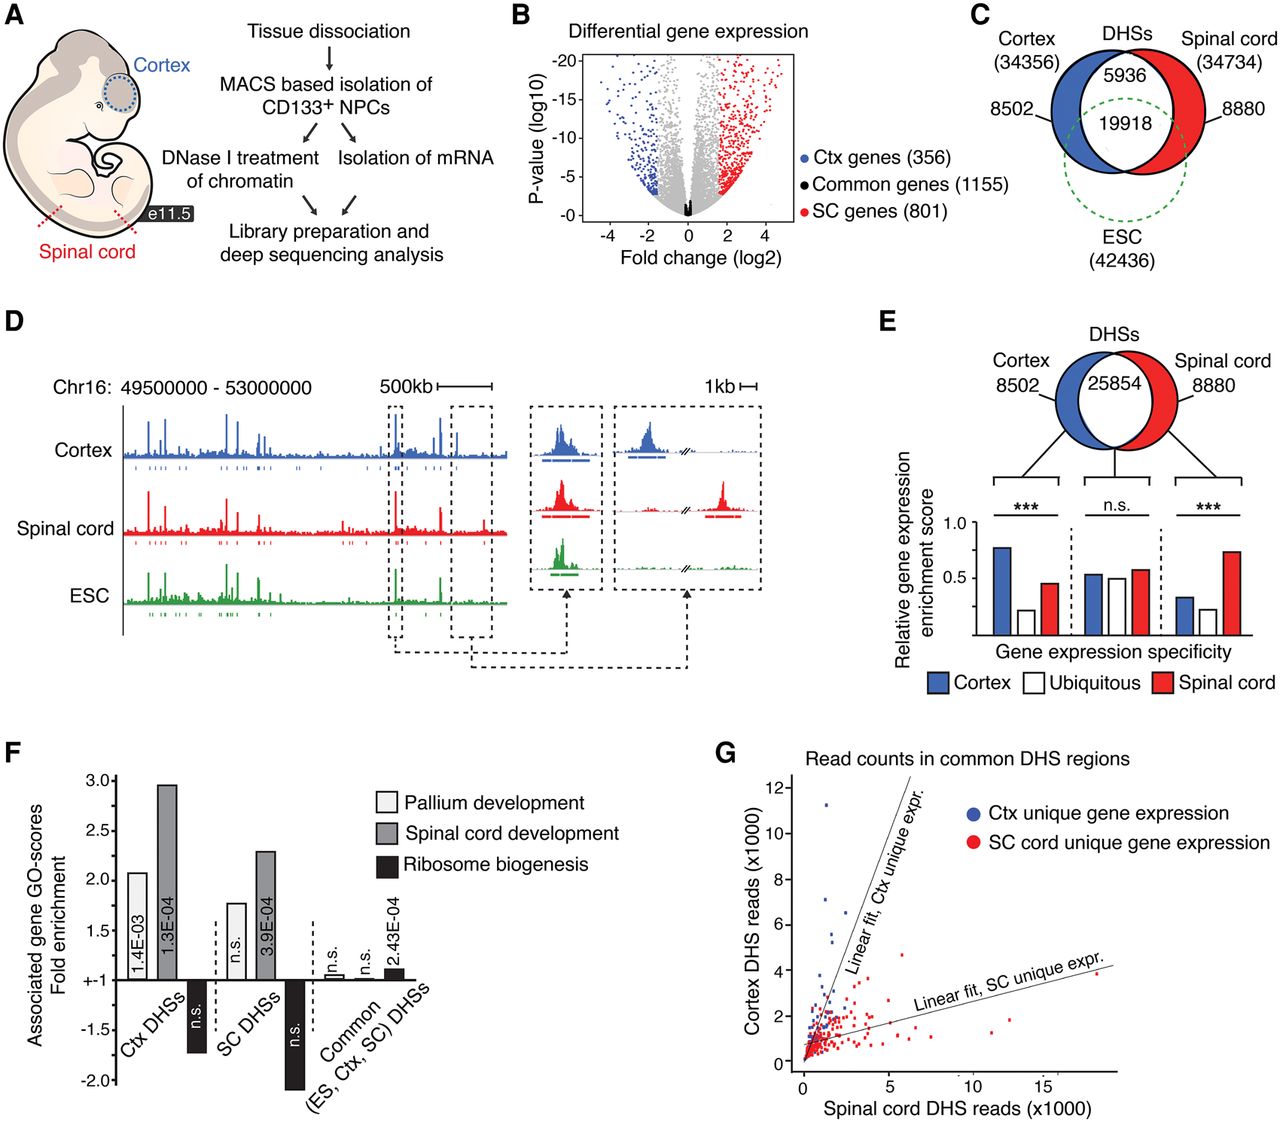
Chromatin landscapes in cortical and spinal cord NSCs. (A) Overview of the in vivo mRNA-seq and DNase-seq experiments. (B) Volcano plot representing genes commonly expressed (expression fold change differences ≤1.1; P ≥ 0.05) in cortical and spinal cord NSCs (black dots) and genes with differential expression (expression fold change difference ≥3; P ≤ 0.01) in NSCs of the cortex (Ctx; blue dots) and spinal cord (SC; red dots). (C) Venn diagram showing the number of total (within parentheses), unique, and overlapping DHSs in ES cells (ESC; green dashed circle), cortical NSCs (blue circle), and spinal cord NSCs (red circle). (D) Example DNase I cleavage density profiles for cortical NSCs (blue), spinal cord NSCs (red), and ES cells (green). (E) Venn diagram and bar graph comparing the enrichment of expression profiles from cortical NSCs (blue bar), spinal cord NSCs (red bar), or in both these cell types (white bar) with genes associated with region-specific (blue and red circle) or common DHSs (white region). (F) GO-enrichment specific term scores for genes associated with cortex (Ctx)-specific DHSs, spinal cord (SC)–specific DHSs, and common (ES cell, Ctx, and SC) DHSs. Light gray bars represent “Pallium development,” medium gray bars represent “Spinal cord development,” and black bars represent “Ribosome biogenesis.” (G) Scatter plot showing the number of sequence reads defining common DHSs in cortical and spinal cord NSCs, depending on whether they are associated with genes exclusively expressed in the cortex (blue dots) or spinal cord (red dots). The specific relationship between chromatin accessibility and gene expression is reflected by angle differences of the group-specific regression lines. The P-value associated with the cortex-specific data, assuming a null hypothesis where the cortex-specific and spinal cord–specific data come from the same distribution, is P < 2.2 × 10⁻¹⁶, whereas for the spinal cord–specific data, P = 2.5 × 10⁻¹⁰. Gene expression specificity, expressed versus not expressed, was defined by an RPKM-cutoff of greater than 5 and less than 1, respectively. (***) P < 0.001.


