
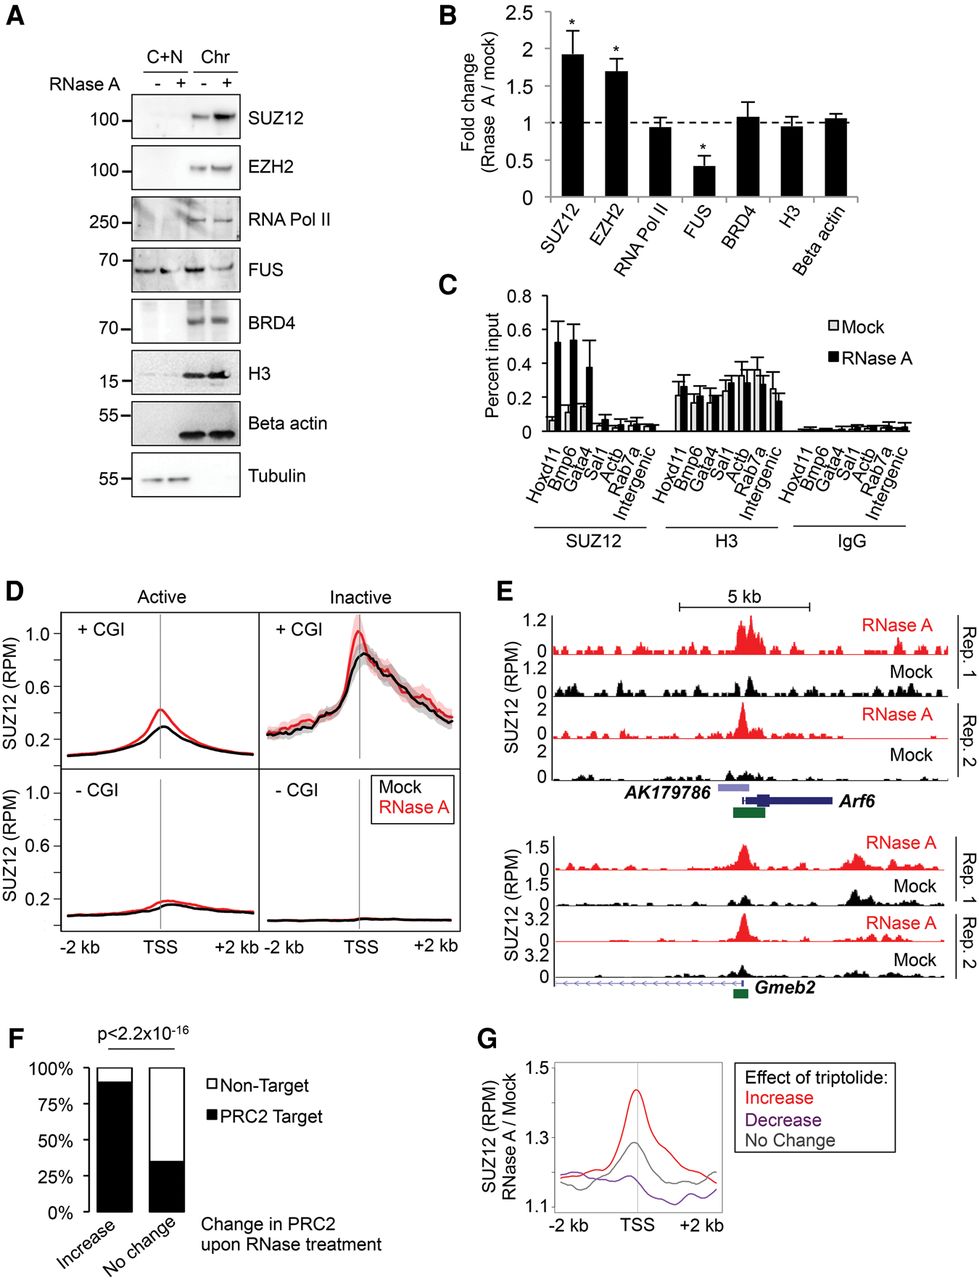
Interaction of PRC2 with chromatin is increased upon RNA degradation. (A) Immunoblots of SUZ12, EZH2, RNA Pol II (POLR2A), FUS, BRD4, histone H3, beta-actin, and alpha-tubulin in cytoplasmic plus nucleoplasmic (C + N) and chromatin (Chr) fractions from mock- or RNase A–treated cells. (B) Ratio of the amount of protein present in the chromatin fraction between RNase A–treated and mock-treated cells (mean and SD, n = 3). (*) P < 0.05 (paired Student's t-test). (C) ChIP-qPCR for SUZ12, EZH2, and histone H3 in mock-treated and RNase A–treated cells (mean and SD, n = 3). (D) Average SUZ12 chromatin binding profiles around gene TSS in mock- (black) and RNase A–treated (red) ESCs (mean and SE). Genes are separated into active (nuclear and total RNA RPKM > 1) and inactive (RPKM = 0) and further divided by the presence or absence of a CpG island (CGI) at their TSS. Data are the average of duplicate experiments. (E) SUZ12 ChIP-seq read density (reads per million) at Arf6 (top) and Gmeb2 (bottom) following mock (black) or RNase A treatment (red) (two replicates). CpG islands are marked in green. (F) Percentage of genes that are occupied by PRC2 in differentiated cells (Yue et al. 2014). Genes are divided into those that gain PRC2 upon RNase A treatment and those that exhibit no change. (G) Average change in PRC2 binding upon RNase A treatment at genes at which PRC2 is gained (red), lost (purple), or unchanged (gray) upon inhibition of RNA Pol II with triptolide.


