
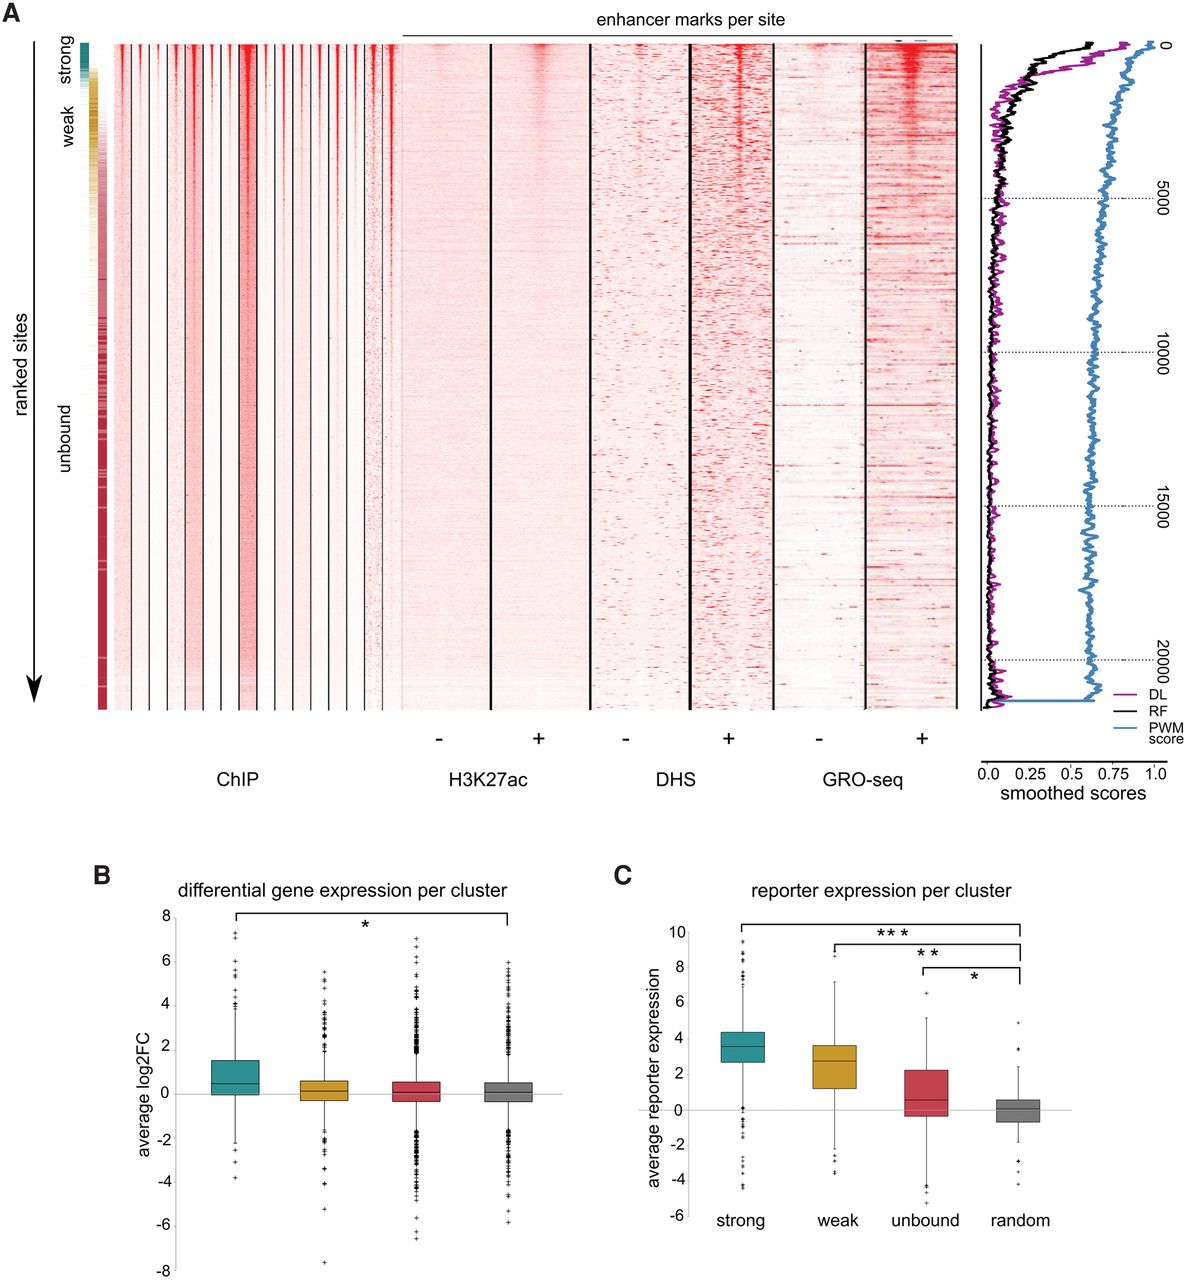
Quantitative prediction of functional TP53 sites. (A) Heatmap showing the TP53 ChIP-seq coverage across all 16 data sets for the approximately 21,000 predicted sites, after rank aggregation, alongside H3K27ac, DNase-seq, and GRO-seq status in untreated and TP53-stabilizing conditions. The color gradient on the left indicates the original clusters from Figure 5. Smoothed scores on the right show gradual decline with the meta-ranking: (DL) deep learning; (RF) random forest; (PWM score) position weight matrix score. (B) For each binding site within the clusters, the closest gene within 20 kb was assigned and the average differential expression was calculated using RNA-seq data. Only strongly bound sites associate with genes that are up-regulated upon TP53 stimulation compared to random control: (*) P-value = 2.45 × 10⁻¹⁰. (C) CHEQ-seq barcode reporter increase is also correlated with the level of binding, as compared to random regions as control: (*) P-value = 9.83 × 10−49; (**) P-value = 4.06 × 10⁻²⁷; (***) P-value = 3.55 × 10⁻⁵.


