
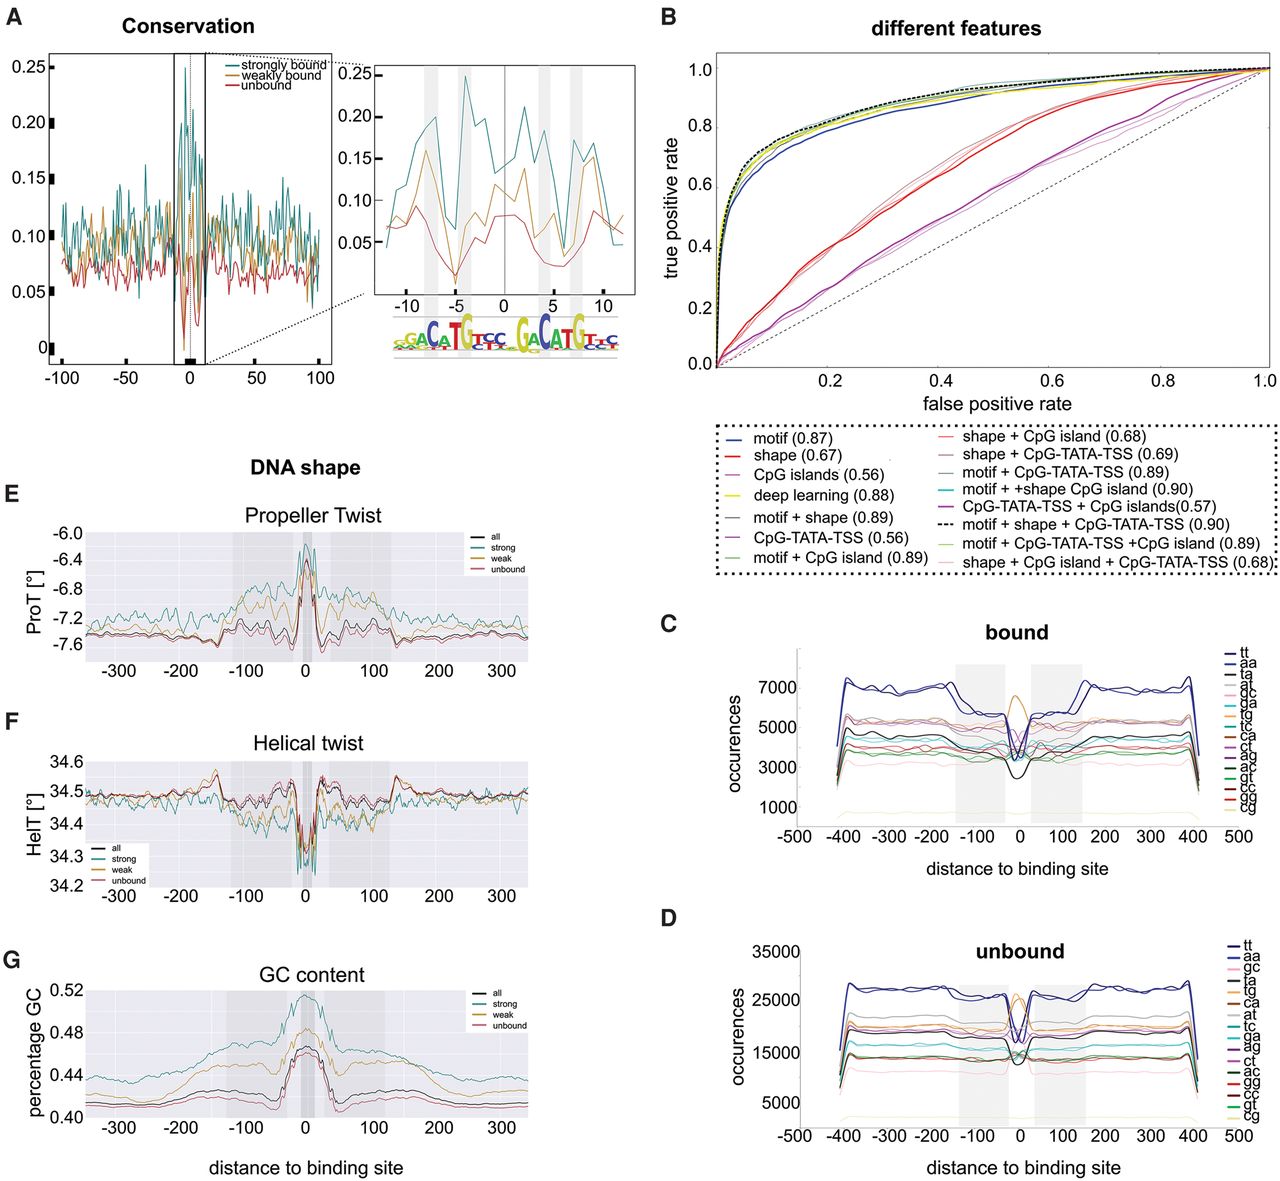
DNA features of TP53 responsive enhancers. (A) Sequence constraint (phastCons) of the DNA sequence around the predicted TP53 binding sites for the three classes (strongly bound, weakly bound, unbound): (inset) zoom in of the TP53 binding sites shows the highest conservation around the core C and G nucleotides. (B) Different features and different machine learning methods were tested individually and in combination for their ability to discriminate strongly bound from unbound binding sites. (C,D) Dinucleotide composition of the 800-bp sequence around the binding sites. Bound sequences (C) show depletion of TT and AA (blue lines) and AT and TA (gray-black lines) at 100 bp flanking the binding site compared to unbound sequences (D). (E–G) DNA shape features within 700 bp sequences around the predicted binding sites. Gray region ∼100 bp away from the binding site shows the strongest differences between bound and unbound sites.


