
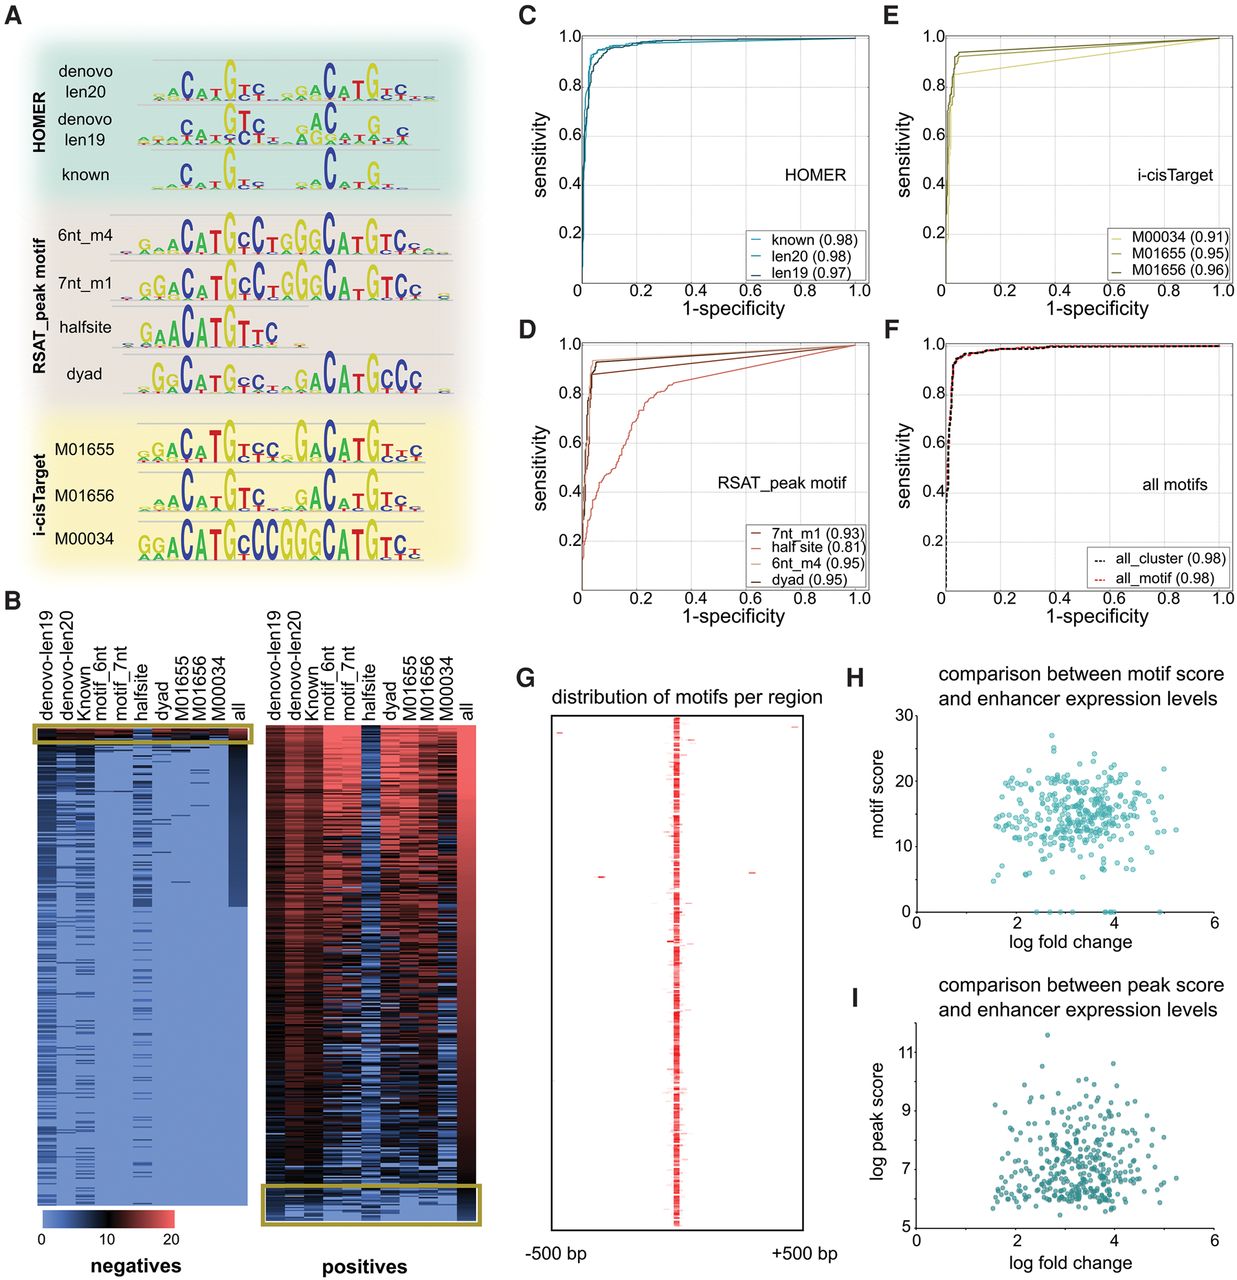
TP53 enhancer model. (A) Ten motifs were selected from motif discovery tools i-cisTarget, HOMER, and RSAT peak motif. (B) Heatmap showing the best Cluster-Buster score for each peak of the nonresponsive (negatives) and TP53-responsive (positives) subset. Discordance between PWM scores and CHEQ-seq are indicated with a yellow box. (C–E) Classification accuracy for each PWM shown as ROC curves. (F) Comparison of a single maximum score (red) versus a homotypic cluster of motifs (black dashed). (G) All positive regions with 1-kb flanking sequence centered on the best scoring motif illustrating the absence of binding site clusters. (H,I) TP53 enhancers are binary on/off enhancers as shown by the lack of correlation between the motif score and barcode expression (H), as well as the lack of correlation between the peak score and the barcode expression (I).


