
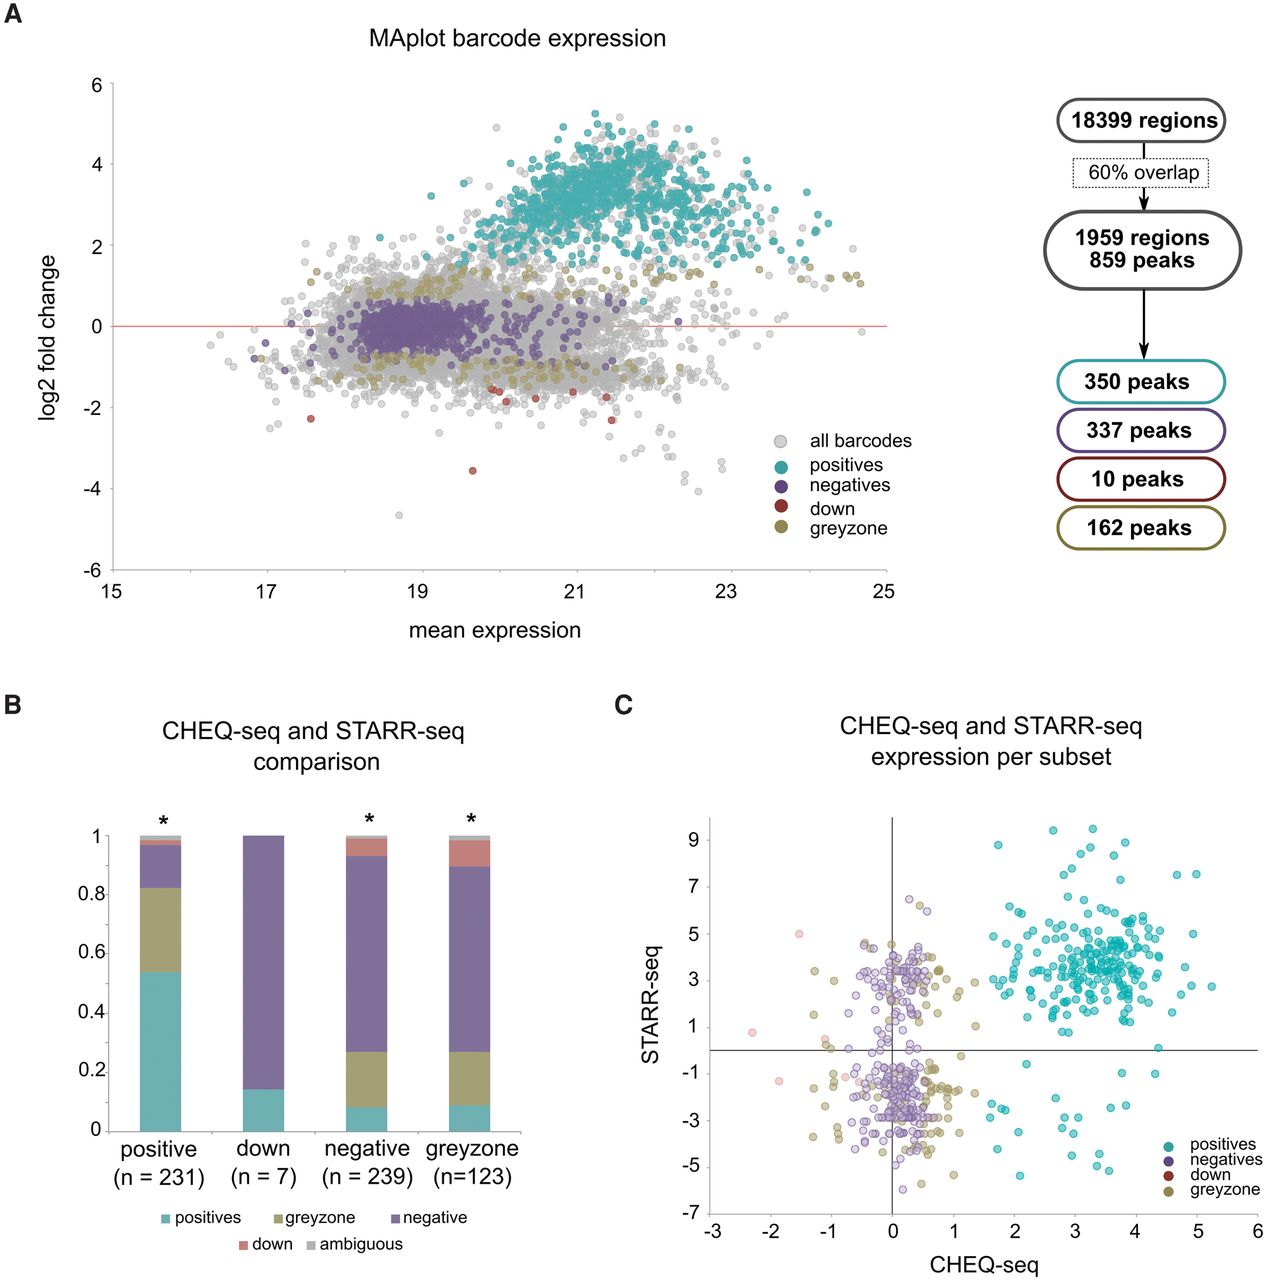
Figure 2.
CHEQ-seq identifies TP53 responsive enhancers. (A) MAplot showing the distribution of CHEQ-seq barcode expression levels versus the fold induction, showing a large number of activation (green), and almost no repression (red). Negatives and grayzone are defined by thresholds on fold-change and significance (Methods). (B) CHEQ-seq positives are mostly positive or grayzone in STARR-seq (first bar), whereas down-regulated regions could not be confirmed by STARR-seq (second bar): (*) P-value <0.001 as determined by χ2. (C) Positives from CHEQ-seq are also mostly (91%) positives in STARR-seq.


