
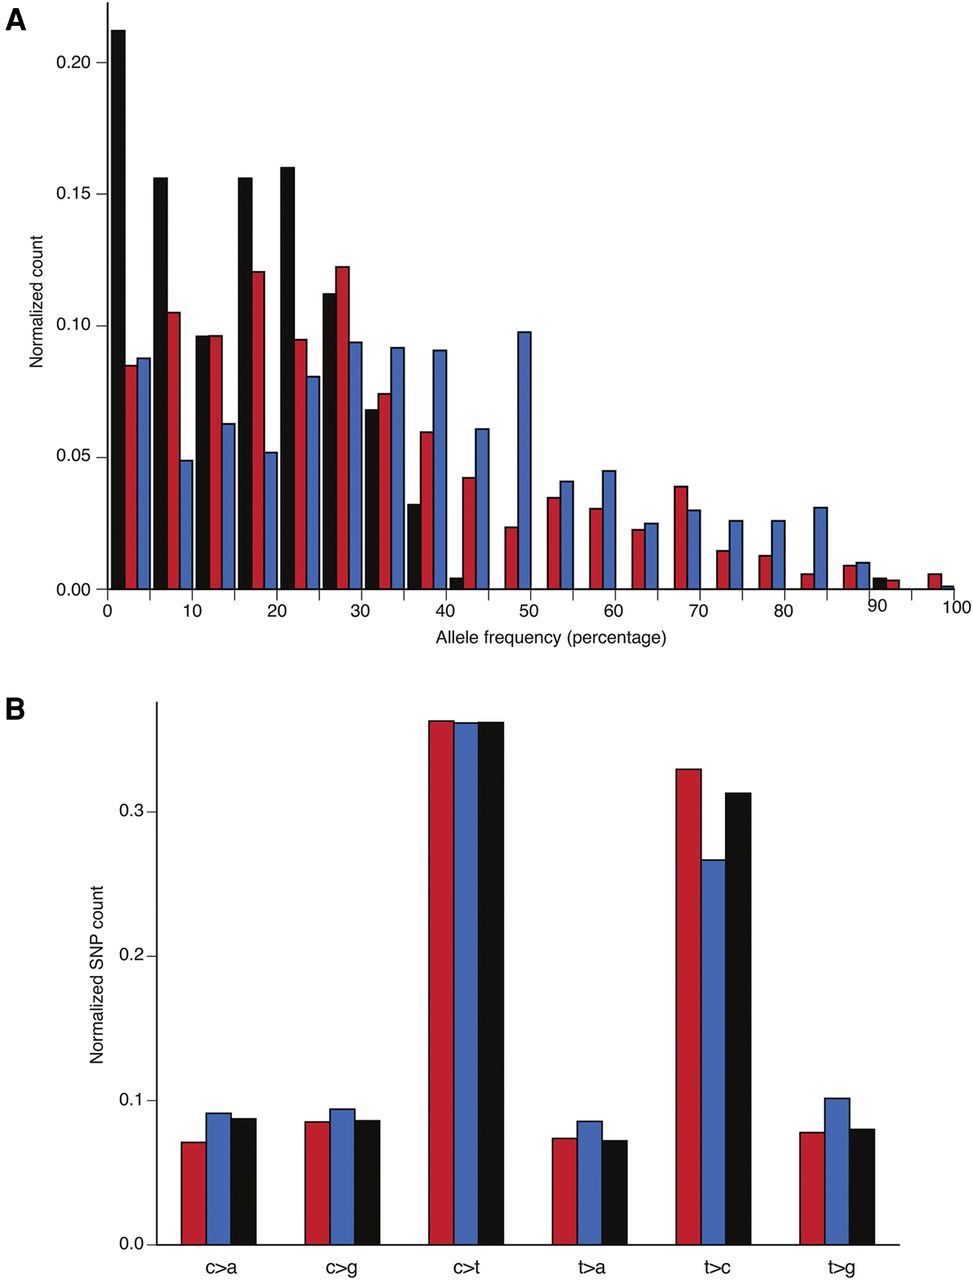
Histograms of normalized allele frequency distributions and normalized mutational profile for NA12878. (A) AF distribution for in-phase TruSeq SNPs (red) is between the distribution for deletions (black) and the distribution for out-of-phase TruSeq SNPs (blue), suggesting that it is a superposition of the two. This pattern is consistent with the hypothesis of SNPs being generated simultaneously with the deletions. (B) Mutational profile for in-phase (red) and out-of-phase (blue) TruSeq SNPs. The six possible transversions and transitions are shown, with the normalized count on the vertical axis. The third bar (black) represents personal genome-wide profile based on heterozygous SNPs.


