
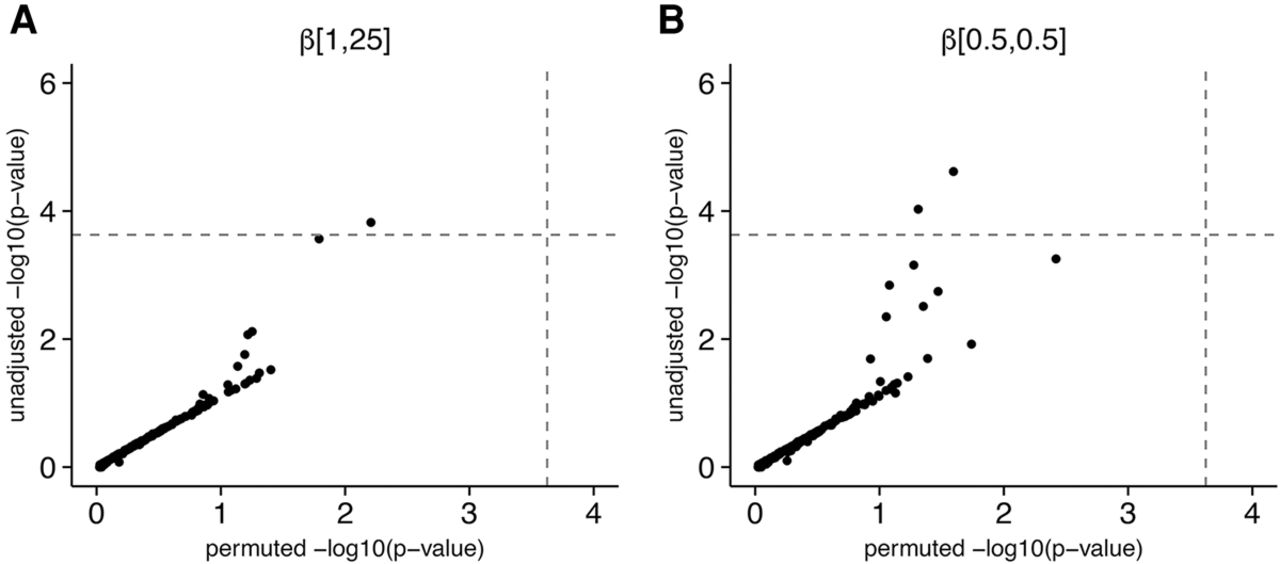
Figure 6.
Scatter plots of unadjusted SKAT-O P-values against permutation-based P-values for tests of association between coding variation in STAT1 and RNA expression levels of STAT1 target genes. Each point represents a single target gene. (A) P-values for the default parameterization of SKAT-O. (B) P-values for the test with more weight shifted onto rare variants.


