
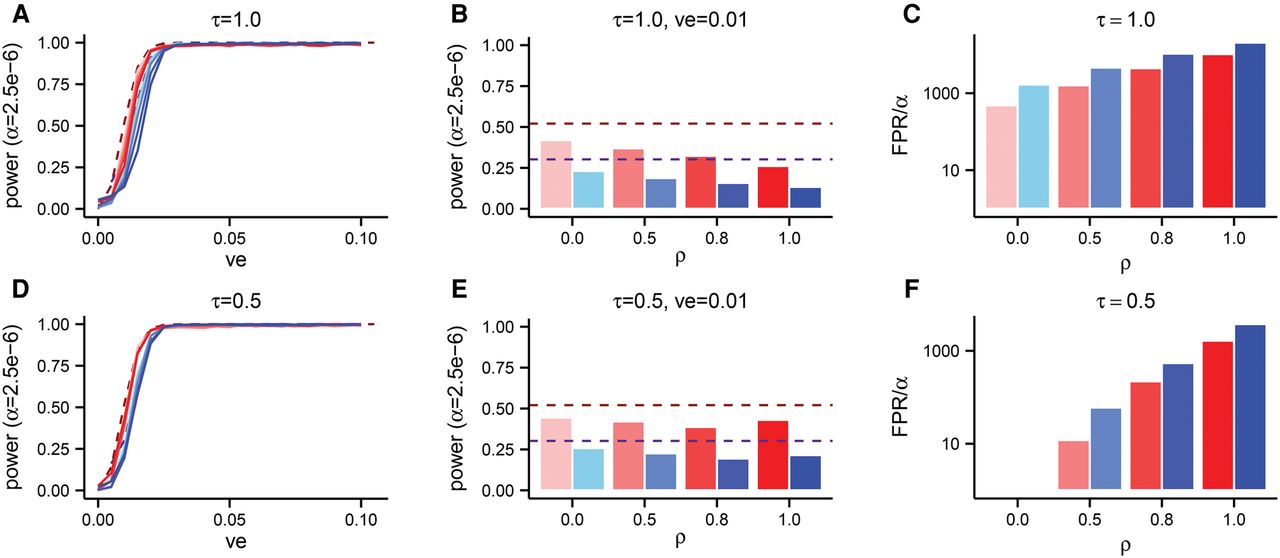
The power and false positive rate (FPR) of SKAT-O in Europeans with the weights of SKAT-O adjusted to β[0.5, 0.5], in a sample size of n = 104 chromosomes. The explosive growth model of Tennessen et al. (2012) is shown in shades of blue, and the growth model of Gravel et al. (2011) is shown in shades of red. The dashed lines show the power when the effect sizes are taken to be proportional to log10(x) for alleles at frequency x, whereas the solid lines (A,D) and bars (B,E) show results from our phenotype model. Each solid line in A and D corresponds to a different value of ρ, using the same color scheme as in the other panels. (B,E) Aggregate data from A and D, but specifically for variance explained (ve) equal to 0.01. In C and F, we plot the FPR divided by 2.5 × 10⁻⁶ (α), which represents the fold increase in FPR.


