
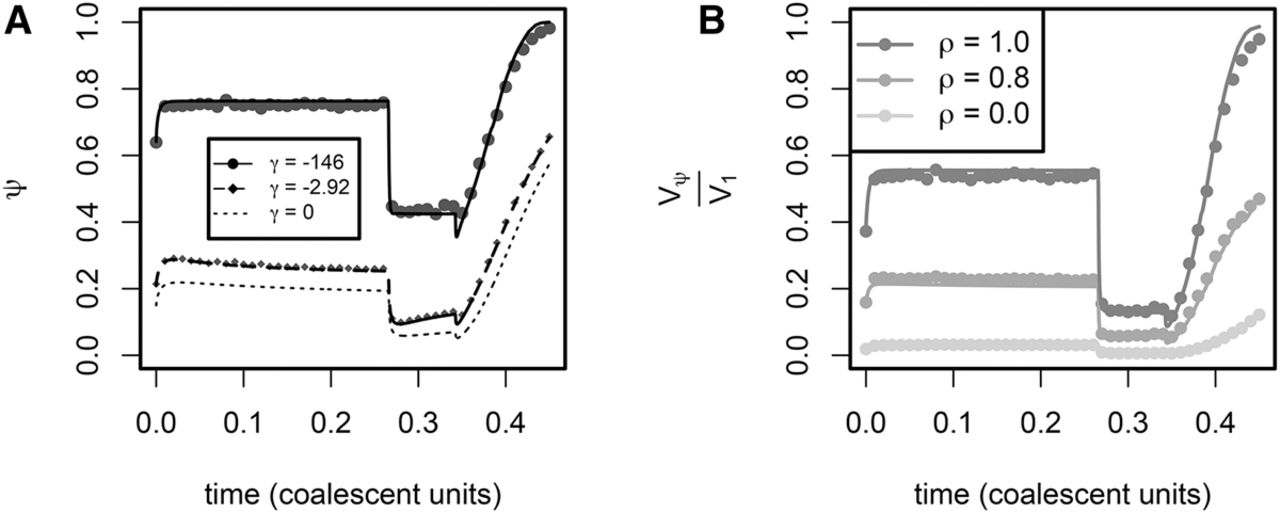
Time-dependence of singleton variants under a European growth model (Gravel et al. 2011). (A) The proportion of variable sites that are singletons (ψ). (B) The proportion of the genetic variance in a complex trait that is due to singletons. A sample of n = 500 chromosomes was used for each panel. The solid, dashed, and dotted lines show the results of our numerical algorithm, whereas the points are the results of stochastic forward simulations. Each point represents the mean across 100 simulations. The demographic model consists of an expansion event at time 0, successive bottlenecks at times 0.27 and 0.34, and sustained exponential growth after the last bottleneck (see Methods, “Calculating the impact of demographic events on genetic architecture” for complete model details).


