
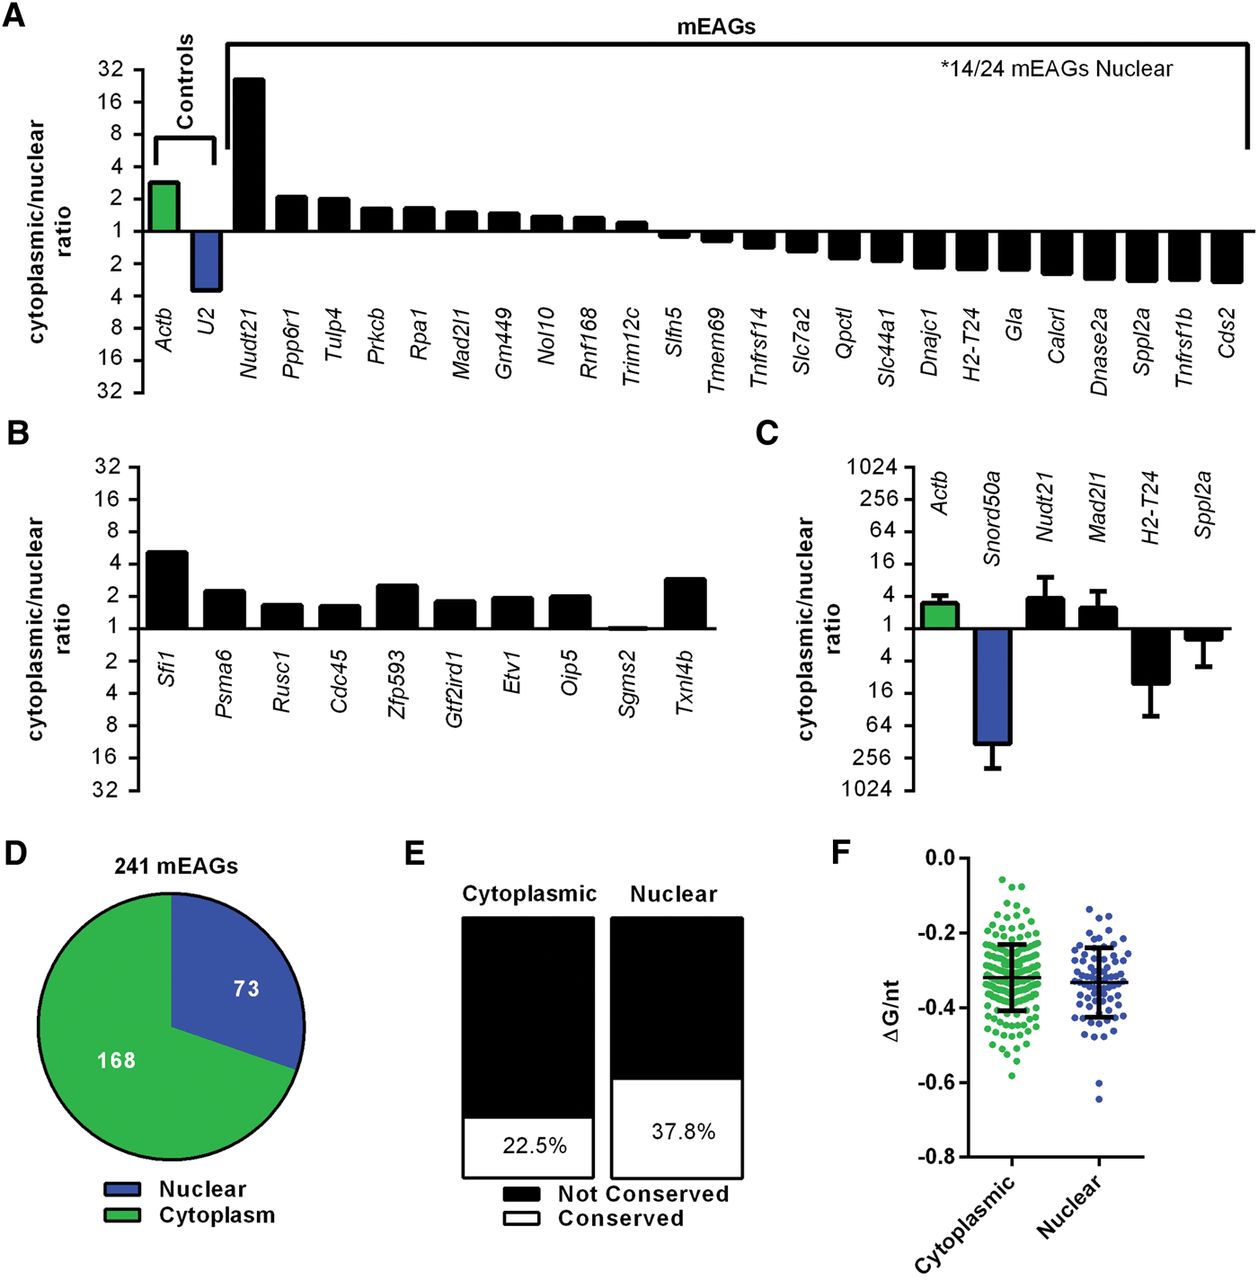
A subset of mEAG transcripts is enriched in the nucleus. Data sets for unstimulated BMDMs (Bhatt et al. 2012) were used to determine the cytoplasmic to nuclear ratio of transcripts for (A) controls and TOP25 mEAGs and (B) 10 randomly selected protein-coding genes. (C) Validation of controls and mEAGs using qRT-PCR of RNA isolated from nuclear or cytoplasmic fractions of unstimulated RAW264.7 macrophages. (D) Predominant cellular localization for all mEAGs using Bhatt et al. data sets. (E) Predominant cellular localization of EAGs found in orthologs of both mouse and human. P = 0.01242 by Z test for two population proportions. (F) Folding free energy per nucleotide (ΔG/nt) for cytoplasmic and nuclear-localized mEERs. P = 0.9109 using Mann-Whitney U test.


